
Rectangular Sums: Approximating Area Under a Curve with Rectangles and Trapezoid
Loading the math board and drawing, please wait…
In collections
AP Calculus AB Applet Collection
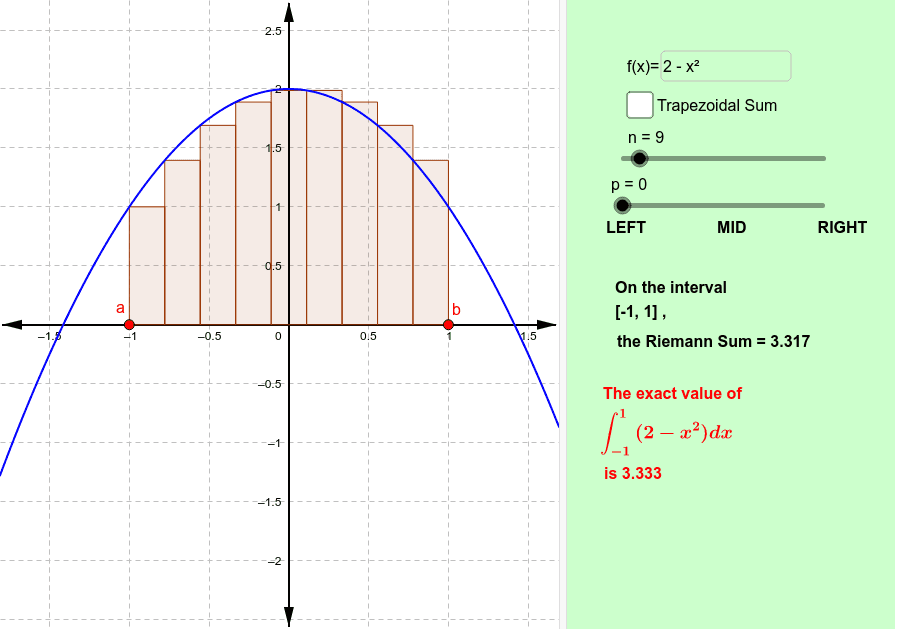
This interactive GeoGebra worksheet shows how the area under a curve can be approximated by summing rectangles (upper and lower Riemann sums) or trapezoids (trapezoidal rule). Users can move a slider to change the number of subintervals n and watch the approximation converge to the exact definite integral. The construction uses the GeoGebra commands RectangleSum and TrapezoidalSum, places points and text fields to label the interval endpoints a and b, displays the computed Riemann sum and trapezoidal sum, and compares them with the exact integral value. It is ideal for high‑school or early‑college calculus students learning about Riemann integration, the definition of the definite integral, and numerical integration techniques.
GeoGebra Commands & Parameters
Textfield(f) → inpFPoint(xAxis) → APoint(xAxis) → BRectangleSum(f, a, b, n, p) → riemsumTrapezoidalSum(f, a, b, n) → trapsum
AI Drawing Prompt Reference
Draw a graph showing the approximation of the area under a curve using rectangles and trapezoids. Include the Riemann sum and trapezoidal sum for a function over an interval [a, b], along with the exact integral value. A slider allows adjusting the number of subintervals to see the approximation converge to the exact value. The graph should contain rectangles, trapezoids, interval endpoints, numerical labels, and a comparison area.
The prompt above was compiled from the original drawing commands and is for reference only.