
Understanding 'x Approaches c' Notation
Loading the math board and drawing, please wait…
In collections
AP Calculus AB Applet Collection
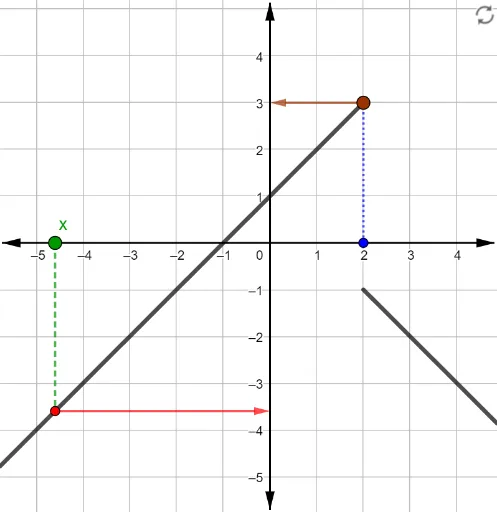
This example demonstrates the geometric interpretation of the limit of a function f(x) as x approaches c. Key math concepts include limits, function graphs, and vectors. It is constructed using GeoGebra commands like Textfield, Point, Vector, and Segment. Suitable for high school students and beginners in calculus.
GeoGebra Commands & Parameters
Textfield(f) → inpFTextfield(c) → inpCPoint(xAxis) → AVector(Pfx, (0, y(Pfx))) → yvecSegment(A, Pfx) → xsegSegment(Pc, Pfc) → csegVector(Pfc, (0, y(Pfc))) → fcvec
AI Drawing Prompt Reference
Draw a function graph and illustrate the concept of a limit as x approaches c. Start by showing the x-axis and a point, then draw a vertical vector from this point to the function graph to represent the function value. Next, mark the point c and its corresponding function value point, draw a line segment from c to the function value point, and then draw a vertical vector from the function value point to the x-axis to clearly demonstrate the limit process.
The prompt above was compiled from the original drawing commands and is for reference only.