
Vertical Asymptotes and Infinite Limits
Loading the math board and drawing, please wait…
In collections
AP Calculus AB Applet Collection
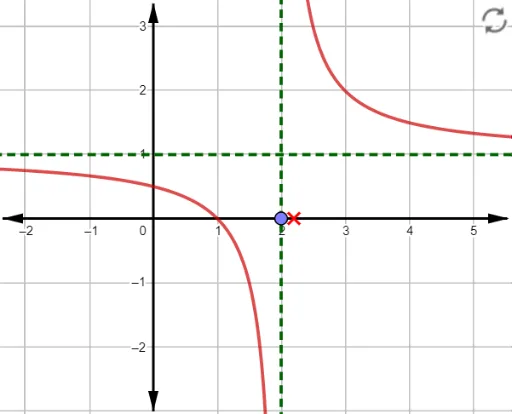
This example illustrates the concept of vertical asymptotes and infinite limits. It shows how the function values approach infinity as the independent variable approaches a specific value. The construction uses Asymptote, Textfield, Point, and other GeoGebra objects, as well as function graphing. Suitable for high school mathematics education and learning about limits.
GeoGebra Commands & Parameters
Asymptote(f) → L_1Textfield(f) → inpFPoint(xAxis) → ATextfield(c) → inpTest
AI Drawing Prompt Reference
Draw a function graph showing vertical asymptotes. The function values approach infinity as the independent variable approaches the asymptote. Include the asymptote, the function curve, and the axes. Construct by first drawing the asymptote, then the function curve, and finally the axes to show the relationship.
The prompt above was compiled from the original drawing commands and is for reference only.