
Rectangle Method Demonstration
Loading the math board and drawing, please wait…
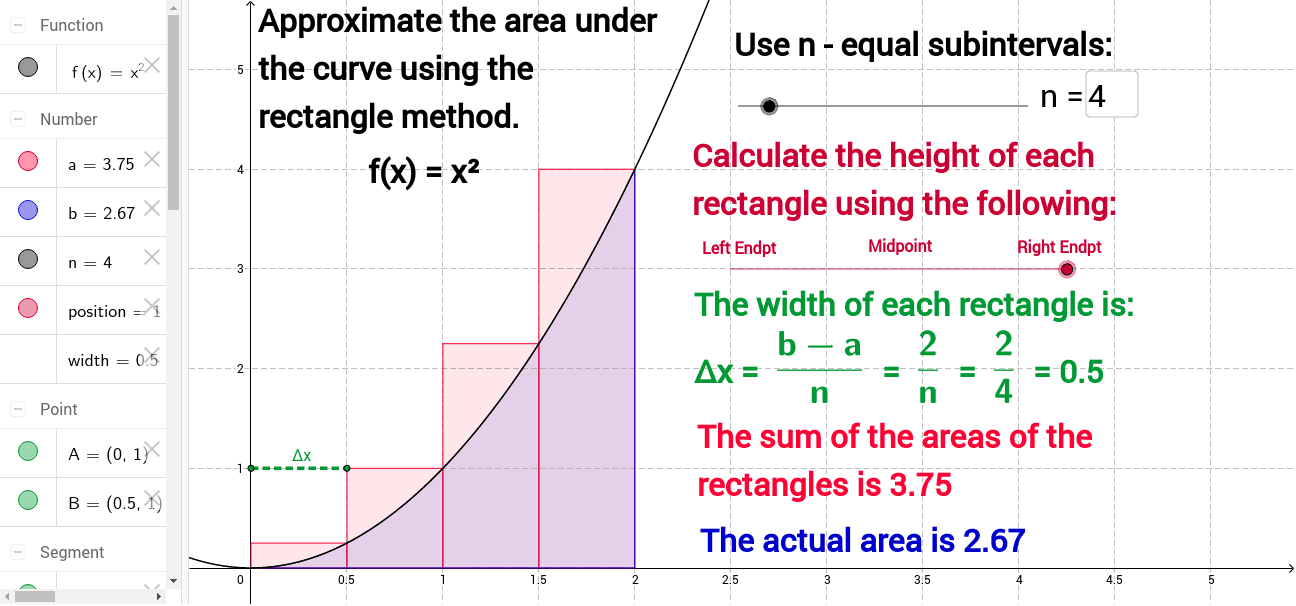
① This example demonstrates the rectangle (Riemann sum) method for numerically approximating the area under a curve. ② Core mathematical concepts: definite integral, Riemann sums, numerical integration, relationship between function graphs and area. ③ Construction highlights: RectangleSum creates the approximating rectangles, IntegralBetween computes the exact integral, Segment marks the interval endpoints, Textfield and inputBox1 allow interactive parameters n, a, b, and text1‑text10 provide labels and readouts. ④ Suitable for high‑school calculus (grades 11‑12) or introductory university calculus, and as a visual aid in numerical analysis courses.
GeoGebra Commands & Parameters
RectangleSum(f, 0, 2, n, position) → aTextfield(n) → inputBox1IntegralBetween(f, 0, 0, 2) → bSegment(A, B) → c
AI Drawing Prompt Reference
Draw an arbitrary function curve and approximate the area under it from x=0 to x=2 using a variable number of rectangles whose heights follow the function; let a slider control the rectangle count. Show the exact definite integral value for the same interval, mark the interval endpoints on the horizontal axis with a segment, and provide input fields so the user can change the number of rectangles, the integration limits, and other parameters, with all labels and numeric readouts updating live.
The prompt above was compiled from the original drawing commands and is for reference only.