
Cubic Function Translation with Sliders
Loading the math board and drawing, please wait…
In collections
quads parabolas
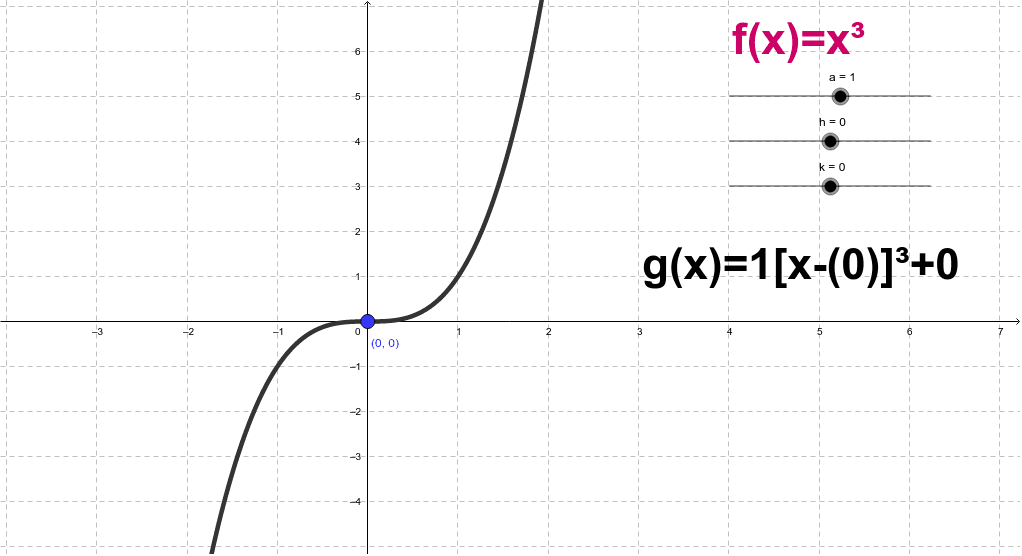
This example demonstrates how the graph of a cubic polynomial shifts horizontally and vertically. It covers the core concepts of cubic functions, function translations, and the effect of parameters on the graph. Construction uses a base function object f, sliders a, h, k to control translation amounts, text objects text1 and text2 for labeling, and auxiliary points A, b, g plus a helper function g to visualize the original and translated curves. It is suitable for high‑school mathematics lessons on function transformations, as well as for college‑prep or self‑study.
GeoGebra Commands & Parameters
f(x) = x^(3)Numeric a(1.0)Numeric h(0.0)Numeric k(0.0)(h, k)x = hg(x) = a * (x - h)^(3) + k
AI Drawing Prompt Reference
Draw a cubic function graph and its translation. Start with the base curve y = x³. Add three sliders to control vertical stretch, horizontal shift, and vertical shift. Show a movable point and a dashed vertical line as a reference for horizontal translation. Display the translated curve with equation: stretch factor times (x minus horizontal shift) cubed plus vertical shift. Label both the original and translated curves with their expressions to illustrate how parameter changes affect the graph's position and shape.
The prompt above was compiled from the original drawing commands and is for reference only.