
Square Root Function with Sliders for Translation Demonstration
Loading the math board and drawing, please wait…
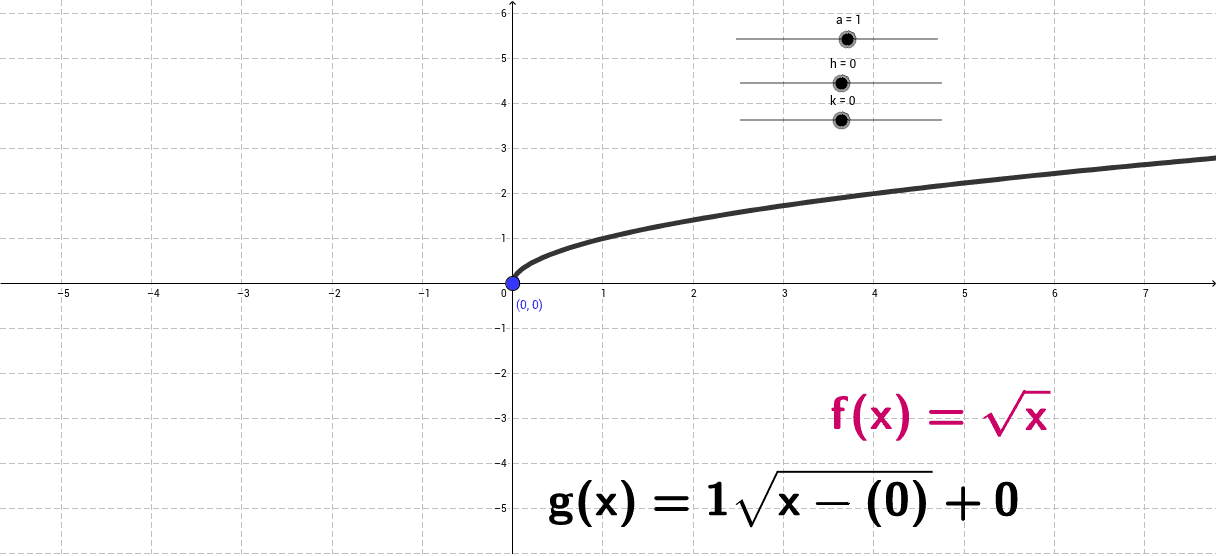
This GeoGebra example demonstrates the graph of a square root function and its translations using interactive sliders. Core mathematical concepts include square root functions, function transformations (horizontal and vertical shifts), vertical scaling, and parameter-graph relationships. The construction uses GeoGebra objects f, a, h, k, text2, A, g, and text1: f defines the base square root function, sliders a, h, and k control vertical scaling, horizontal translation, and vertical translation respectively, while point A, function g, and text objects text1 and text2 dynamically display the transformed graph, key points, and algebraic expressions. Suitable for high school mathematics teaching, classroom demonstrations, and student exploration of function transformation rules.
GeoGebra Commands & Parameters
f(x) = sqrt(x)Numeric a(1.0)Numeric h(0.0)Numeric k(0.0)(h, k)g(x) = a * sqrt(x - h) + k
AI Drawing Prompt Reference
Draw the graph of a square root function with sliders to control its horizontal and vertical translations and vertical scaling. Start by plotting the base square root function, then use two sliders for horizontal and vertical translation, and vertical scaling. Finally, display the transformed graph, key points, and algebraic expressions to observe the rules of function transformations.
The prompt above was compiled from the original drawing commands and is for reference only.