
Absolute Value Function Translation with Sliders
Loading the math board and drawing, please wait…
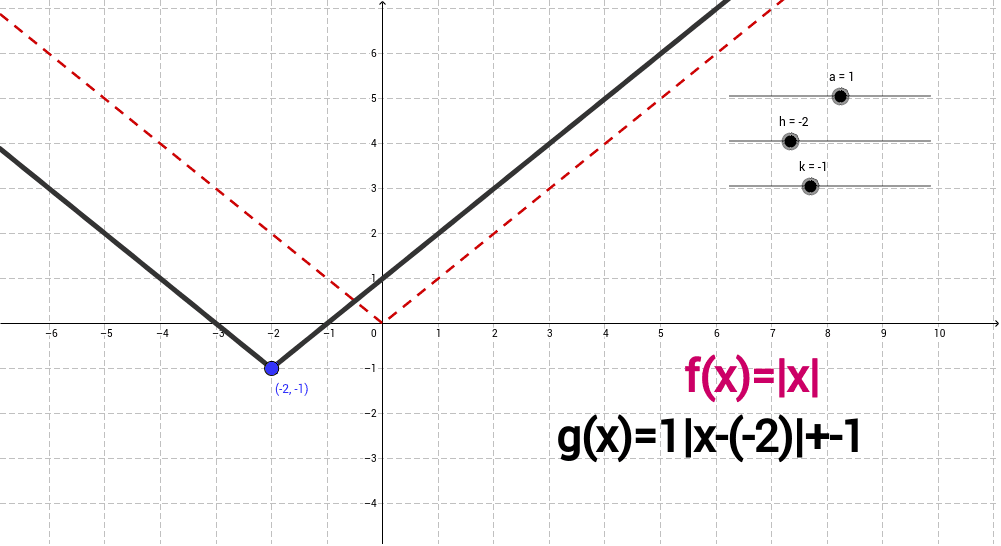
This example demonstrates how the graph of the absolute value function f(x)=a·|x‑h|+k translates and stretches as the parameters a, h, and k are varied via sliders. Core concepts include absolute value function properties, function transformations (translation and scaling), and parameter influence on graphs. Construction uses a Function object for f, Slider objects for a, h, k, Text objects (text1, text2) for dynamic labels, and Point objects A, b, g as reference points. It is suitable for high‑school algebra or pre‑calculus lessons on function transformations, as well as for independent student exploration.
GeoGebra Commands & Parameters
f(x) = abs(x)Numeric a(1.0)Numeric h(-2.0)Numeric k(-1.0)(h, k)x = hg(x) = a * abs(x - h) + k
AI Drawing Prompt Reference
Draw an absolute value function graph with the base curve y = |x| and three sliders that adjust the vertical stretch factor a, horizontal shift h, and vertical shift k. The transformed curve y = a·|x−h|+k updates in real time, showing its vertex at (h, k) and axis of symmetry x = h, while dynamic text labels display the current parameter values. Also keep the original y = |x| as a reference background.
The prompt above was compiled from the original drawing commands and is for reference only.