
Rational Function Graphing Demo
Loading the math board and drawing, please wait…
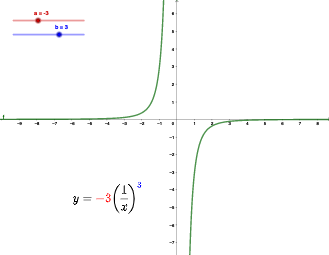
This example demonstrates how to graph rational functions by dynamically adjusting parameters a and b using sliders. Key math concepts include function graphs, quadratic equations, median lines, distributions, random experiments, and special points. GeoGebra commands objects a, b, f, and text1 are used, where a and b control function parameters, f represents the function object, and text1 displays relevant information. Suitable for high school mathematics education to understand function graph properties and the impact of parameters on function shapes.
GeoGebra Commands & Parameters
Numeric a(-3)Numeric b(3)f(x) = (a * (1 / x)^(b))
AI Drawing Prompt Reference
Draw a rational function graph where parameters a and b control the shape of the function, with a ranging from -3 to 3 and b from 3 to -3. First set the values of a and b, then plot the function f(x) = a * (1 / x)^b, and finally show how the parameters affect the shape of the function.
The prompt above was compiled from the original drawing commands and is for reference only.