
Rates of Change on a Parabola
Loading the math board and drawing, please wait…
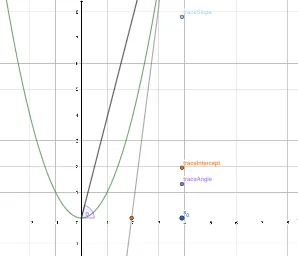
This example demonstrates the relationship between the slope of a tangent line at a point on a parabola and the right triangle formed. It involves core math concepts like derivatives, coordinate geometry, tangents, slopes, and angles. Constructed using GeoGebra commands: Point, Tangent, Slope, Intersect, Segment, Angle. Suitable for high school and above students to understand the geometric meaning of derivatives in calculus and practical applications.
GeoGebra Commands & Parameters
Point(xAxis) → x_{0}Tangent(B, f) → gSlope(g) → mIntersect(g, xAxis) → CIntersect(f, xAxis, 1) → ASegment(A, B) → hAngle(xAxis, h) → θ
AI Drawing Prompt Reference
Draw a parabola graph showing the tangent line at a point on the parabola, its intersection with the x-axis, the intersection of the parabola with the x-axis, the line segment connecting these two points, and the angle formed by the x-axis and the line segment. Emphasize the relationship between the slope of the tangent line and the rate of change of the parabola, and how these elements illustrate the geometric meaning of derivatives.
The prompt above was compiled from the original drawing commands and is for reference only.