
Polynomial Derivative Graph with Tangent and Slope Analysis
Loading the math board and drawing, please wait…
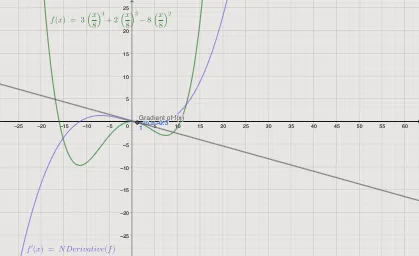
This GeoGebra example dynamically visualizes the derivative graph of a polynomial function, illustrating the geometric relationship between a function and its derivative. It demonstrates the core concepts of derivatives, tangents, roots, intersection points, and slope. Construction utilizes key GeoGebra commands including NDerivative, Tangent, Root, Intersect, and Slope, operating on function f, its derivative f', and points A, B, C, D. The model is suitable for high school and early college calculus courses, supporting intuitive teaching of derivative meaning, tangent line equations, function feature analysis, and the connection between algebraic expressions and graphical behavior.
GeoGebra Commands & Parameters
NDerivative(f) → f'Tangent(a, f) → gRoot(g) → BIntersect(g, yAxis) → CSlope(g) → m
AI Drawing Prompt Reference
Draw a graph showing a polynomial function and its derivative. The graph includes the function f, its derivative f', the tangent line g at a point a on f. The tangent line g intersects the x-axis at point B and the y-axis at point C. The slope of the tangent line g is denoted as m. These elements help visualize the geometric meaning of the derivative, the equation of the tangent line, function feature analysis, and the connection between algebraic expressions and graphical behavior.
The prompt above was compiled from the original drawing commands and is for reference only.