
Random Variables Demo
Loading the math board and drawing, please wait…
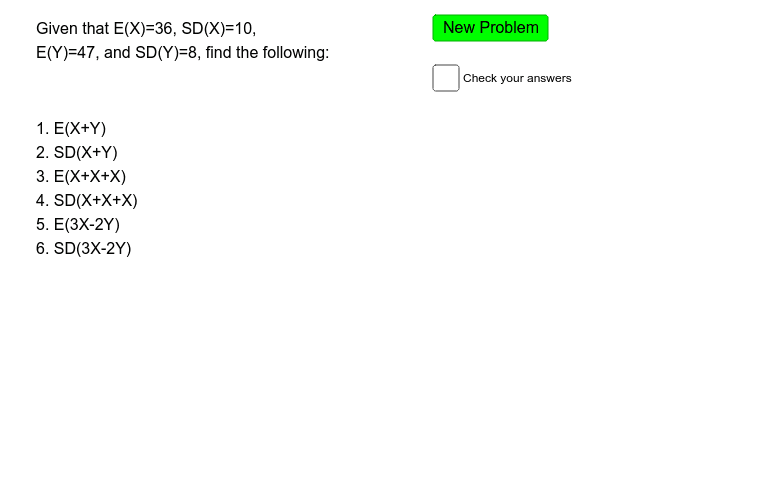
This example demonstrates the generation and distribution of random variables. It involves core math concepts like random variables, correlation, hypergeometric distribution, power functions, and arithmetic operations. Construction highlights include using GeoGebra commands/objects such as RandomElement, Random, s, m, button1, mux, sdx, muy, sdy, text2, text1_1, text1, text3, text4, a. Suitable for high school students and educators in probability & statistics for teaching and exploration.
GeoGebra Commands & Parameters
RandomElement({-3, -2, 2, 3, 4}) → sRandomElement({0.25, 0.5, 0.75, 2, 3, 4}) → mRandom(20, 50) → muxRandom(5, 15) → sdxRandom(20, 50) → muyRandom(5, 15) → sdy
AI Drawing Prompt Reference
Create a random variable demonstration that randomly selects one value from the integer set {-3, -2, 2, 3, 4} and one from the fractional set {0.25, 0.5, 0.75, 2, 3, 4}, then generates random means between 20 and 50 and standard deviations between 5 and 15 for two variables, and visualizes their distributions with histograms or density curves together with a scatter plot showing their correlation, illustrating the generation, distribution, and correlation analysis of random variables.
The prompt above was compiled from the original drawing commands and is for reference only.