
Normal Distribution: Key Concept in Probability Statistics
Loading the math board and drawing, please wait…
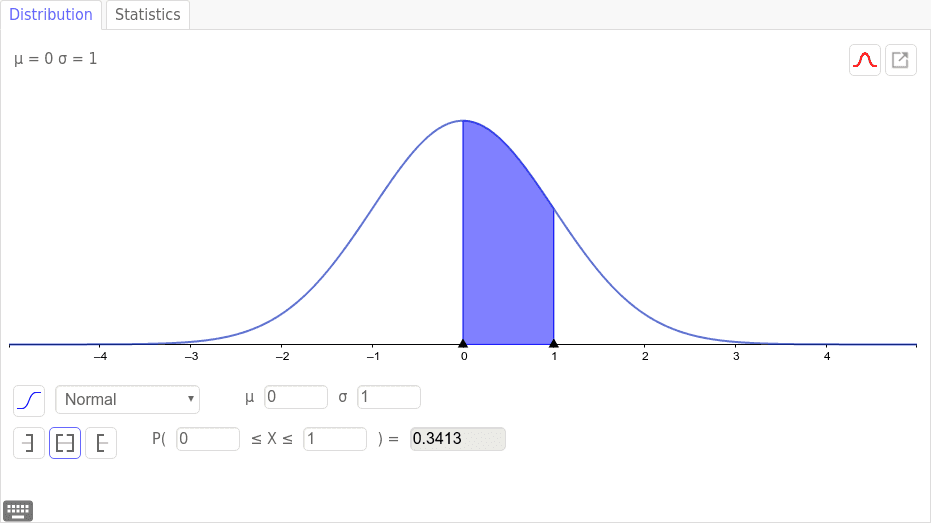
The normal distribution is a fundamental model in probability and statistics, describing the distribution of data. Key mathematical concepts include mean, standard deviation, and probability density function. Construction involves using GeoGebra's statistical tools to draw the normal curve, calculate mean and standard deviation, and display data point distribution. Suitable for high school students learning probability statistics or introductory data analysis.
AI Drawing Prompt Reference
Create a normal distribution curve with a bell-shaped symmetric form. Mark the peak as the mean, and indicate positions at one and two standard deviations on either side. Shade the area under the curve representing the 68% probability within one standard deviation from the mean. Include coordinate axes with the x-axis showing data values and the y-axis showing probability density. The curve should be smooth and symmetric around the vertical line at the mean.
The prompt above was compiled from the original drawing commands and is for reference only.