
More Practice with Derivatives: Tangent Slopes via Interactive Buttons
Loading the math board and drawing, please wait…
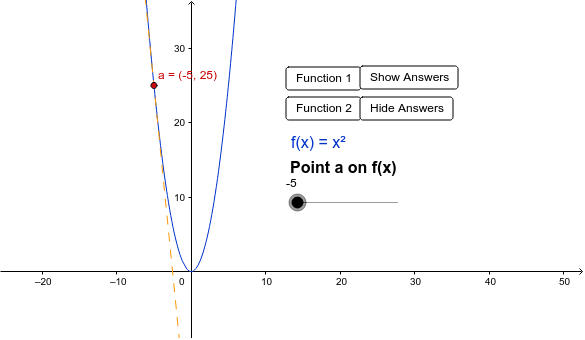
① This interactive GeoGebra example demonstrates how to compute the slope of a tangent line at a point on a function graph, reinforcing the geometric interpretation of derivatives. ② Core math concepts include derivatives, tangent line slope, rate of change, and connections between algebra and geometry, with auxiliary elements like quadrilaterals and angles to enrich the visual context. ③ Construction highlights: uses the Tangent command to draw the tangent line and the Slope command to calculate its slope; objects include buttons button1–button4, function f, texts text1 and text2, parameters a, b, c, m, and showAnswer for toggling answers, enabling step-by-step interactive practice. ④ Suitable for high school or early college calculus students, ideal for classroom exercises or self-study to deepen understanding of derivative definitions and tangent line equations.
GeoGebra Commands & Parameters
Tangent(a, f) → cSlope(c) → m
AI Drawing Prompt Reference
Create an interactive mathematical visualization showing the tangent line and its slope at a point on a function graph. Display a smooth curve in the coordinate system with a movable control point on the curve, draw the tangent line through that point, and show the slope value nearby. Include several interactive buttons to switch between different functions or adjust the point position, along with angle measurements and auxiliary geometric shapes like quadrilaterals to help understand the relationship between the tangent line and the curve. The design demonstrates the geometric interpretation of derivatives for teaching purposes.
The prompt above was compiled from the original drawing commands and is for reference only.