
Radioactive Decay Model: Exponential Attenuation with Calculus Visualization
Loading the math board and drawing, please wait…
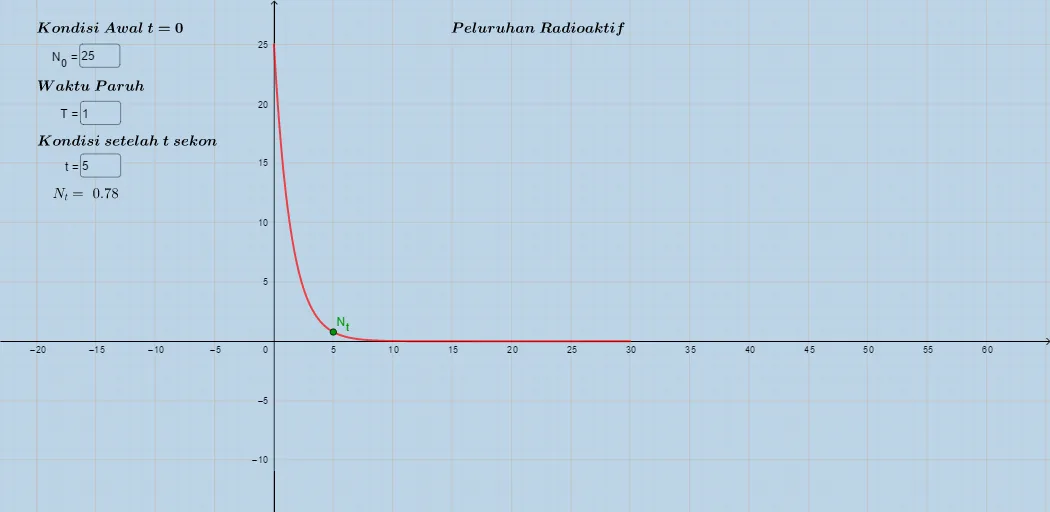
This GeoGebra example demonstrates how the amount of a radioactive substance changes over time, visualizing the exponential decay law and relating it to calculus ideas about the decay rate. Key math concepts include exponential functions (and the typical use of logarithmic relationships for understanding parameters), interactive function graphing, and the derivative as an instantaneous rate of change. Construction focuses on GeoGebra Textfield and InputBox objects to input and adjust parameters and variables such as N0, Nt, time t, and quantities like A, while the object f represents the decay function used for plotting and updating results. Additional text objects (text1–text5) label variables and display expressions/outputs to make the model interpretable. Suitable for high school and early undergraduate instruction on mathematical modeling, exponential/logarithmic functions, and calculus applications to rate-of-change visualization.
GeoGebra Commands & Parameters
Textfield(N_{o}) → InputBox1Textfield(T) → InputBox2Textfield(t) → InputBox3
AI Drawing Prompt Reference
Create a graph showing the exponential decay model of a radioactive substance, with input boxes for initial amount N0, time interval T, and time t, and a function plot representing the decay process. Label variables and expressions to illustrate the relationship between decay rate and derivatives, suitable for high school and early college mathematical modeling instruction.
The prompt above was compiled from the original drawing commands and is for reference only.