
Geometric Demo of Wave Phase and Phase Difference
Loading the math board and drawing, please wait…
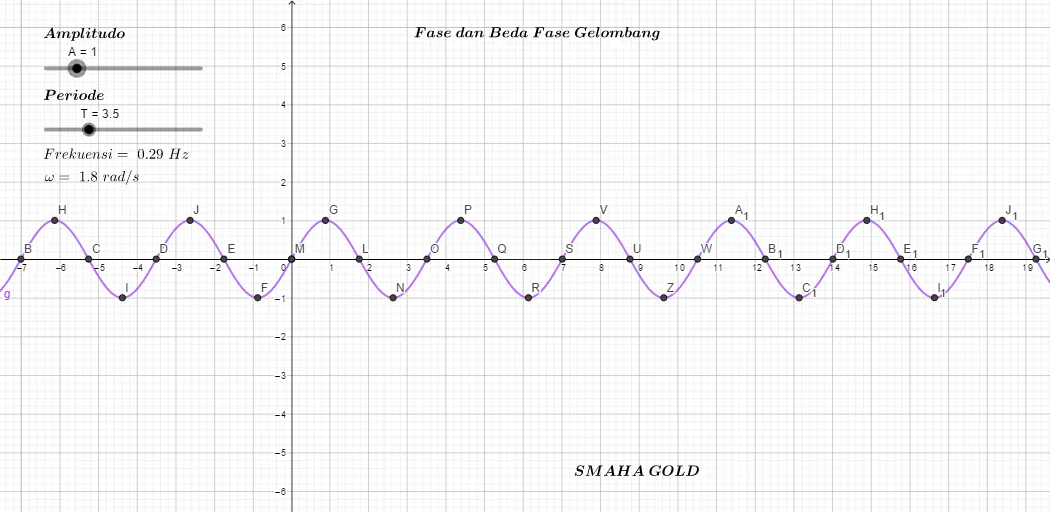
This example visually compares the phase locations of sine-type waves within a shared coordinate setup, showing how changing the phase (and thus the phase difference) shifts the wave pattern horizontally. It focuses on key ideas such as phase, phase difference, trigonometric (sine) relationships for wave behavior, and identifying critical points like intersections and extrema that correspond to meaningful phase positions. Construction highlights: GeoGebra commands Roots, Extremum, and Intersect are used to compute roots, locate extremum points, and find intersections between constructed objects and functions. A collection of labeled points (e.g., A, T, B, C, D, E, K, L, O, Q, S, U, W and indexed variants like A_1, C_1, H_1, I_1) together with text labels (text1–text5) marks the phase-relevant positions and conveys how the phase shift alters the waveform. Suitable for secondary-to-intro-university instruction on trigonometry and modeling waves in interactive demonstrations and review activities.
GeoGebra Commands & Parameters
Roots(g) → B, C, W, B_1, D_1, E_1, F_1, G_1, , , , , D, , , , , , , , , , , E, , , , , , , , , , , K, L, O, Q, S, UExtremum(g) → H, I, A_1, C_1, H_1, I_1, J_1, , , , , , J, , , , , , , , , , , F, , , , , , , , , , G, N, P, R, V, ZIntersect(g, yAxis, (0, 0)) → M
AI Drawing Prompt Reference
Draw a sine wave in a coordinate system and mark its zero points, extremum points, and intersection with the y-axis. Adjust the phase to show how the wave shifts horizontally. Add labels like A, B, C to indicate key positions to help understand the concept of phase difference.
The prompt above was compiled from the original drawing commands and is for reference only.