
Radford University GeoGebra Webinar: Calculus Visualization
Loading the math board and drawing, please wait…
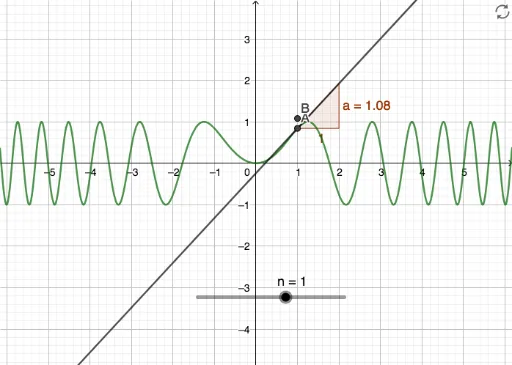
This example demonstrates how to use GeoGebra to dynamically visualize core calculus concepts, including function graphs, tangent line slopes, and the geometric meaning of definite and indefinite integrals. It uses interactive sliders and dynamic objects to show the derivative as the slope of a tangent line, the integral as accumulation of area, and the approximation of definite integrals via Riemann sums (upper and lower sums). The construction employs the Tangent command to draw the tangent line to function f at point A, the Slope command to compute its slope, and defines objects such as n (number of subdivisions), g (auxiliary function), a (lower limit), and B (upper limit) to build a dynamic integral demonstration. This example is suitable for university calculus courses or advanced high school mathematics, helping students grasp the geometric intuition of derivatives and integrals, as well as numerical approximation methods.
GeoGebra Commands & Parameters
Tangent(A, f) → gSlope(g) → a
AI Drawing Prompt Reference
Create a dynamic visualization for calculus concepts. Start with a smooth function curve, and place a movable point on it. Draw the tangent line to the curve at that point, and display the slope value of this tangent line, which updates as the point moves. Additionally, show an area accumulation region under the curve composed of multiple small rectangles, approximating the area, with the number of rectangles adjustable via a slider. Mark the lower and upper limits of the integration interval, and illustrate the geometric meaning of the definite integral as the area between the curve and the x-axis. The overall graphic should include the function curve, tangent line with its slope, dynamic area approximation, and integration interval markers, suitable for university-level calculus teaching.
The prompt above was compiled from the original drawing commands and is for reference only.