
Quartic Function and Its Graphical Exploration
Loading the math board and drawing, please wait…
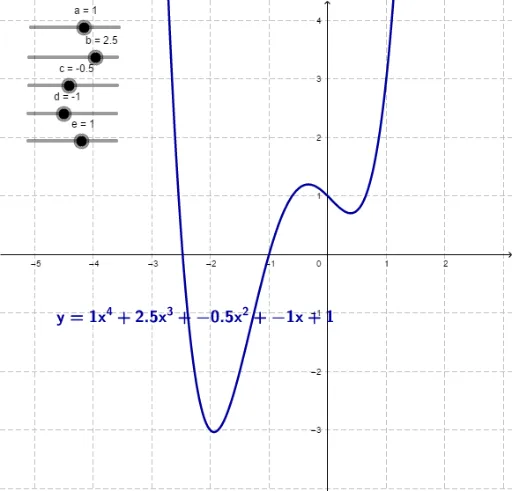
①This example demonstrates the graph of a quartic function (a polynomial of degree four) and how its shape changes as coefficients are varied. ②Core mathematical concepts include quartic polynomials, function graphing, symmetry, extrema, roots, and transformations such as translation and scaling. ③Construction highlights: from the summary, parameters a, b, c, d, e, f are used as coefficients or constants, and text1 displays the function expression; users can adjust these parameters via sliders or input fields to observe real-time changes in the graph. ④Suitable for high school and above, this is ideal for teaching functions and graphs, exploring polynomial properties, and serving as a visual introduction to derivative and extremum concepts in calculus.
GeoGebra Commands & Parameters
Numeric a(1)Numeric b(2.5)Numeric c(-0.5)Numeric d(-1)Numeric e(1)f(x) = (a * x^(4)) + (b * x^(3)) + (c * x^(2)) + (d * x) + e
AI Drawing Prompt Reference
Draw the graph of a quartic function defined by y = a·x⁴ + b·x³ + c·x² + d·x + e, with coefficients a, b, c, d, e adjustable via sliders, initially set to 1, 2.5, -0.5, -1, and 1 respectively. The graph should show a smooth quartic curve with possible two extrema and one inflection point, changing shape, translating, or scaling as coefficients vary. Display the function expression as text on the graph, and include sliders for real-time adjustment. Clearly show coordinate axes, suitable for teaching polynomial properties and transformations.
The prompt above was compiled from the original drawing commands and is for reference only.