
Cubic Function Demo
Loading the math board and drawing, please wait…
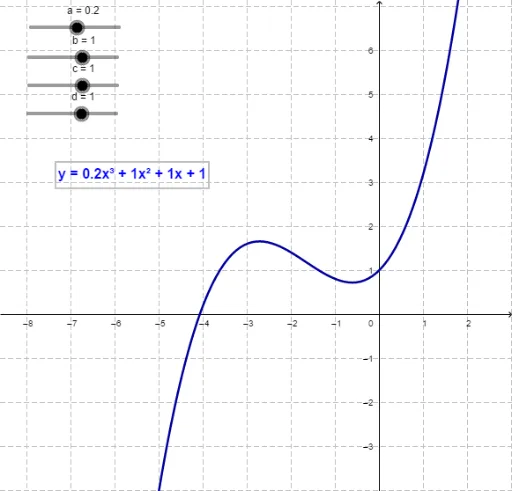
This example demonstrates the graph of a cubic function and how its parameters affect its shape. Key math concepts include polynomial functions, function graphs, and the impact of parameters. Constructed using GeoGebra objects: a, b, c, d, text1, f. Suitable for high school mathematics teaching or function graph learning.
GeoGebra Commands & Parameters
Numeric a(0.2)Numeric b(1)Numeric c(1)Numeric d(1)f(x) = (a * x^(3)) + (b * x^(2)) + (c * x) + d
AI Drawing Prompt Reference
Draw the graph of a cubic function, showing how its parameters affect its shape. Include a curve representing the cubic function and four parameters that control different aspects of the curve. Label these parameters on the graph and add text explaining their impact on the function's graph, suitable for high school mathematics teaching or function graph learning.
The prompt above was compiled from the original drawing commands and is for reference only.