
Secant & Tangent
Loading the math board and drawing, please wait…
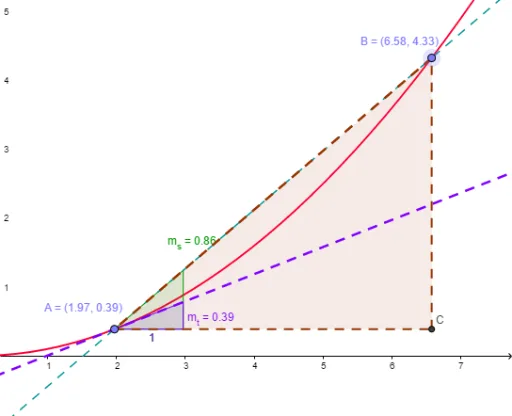
This graph demonstrates secant and tangent lines to compare average and instantaneous rates of change. Key mathematical concepts include derivatives and calculus. Constructed using GeoGebra commands such as Point, Line, Tangent, Intersect, Segment, Slope, and Polygon. Suitable for high school mathematics education and learning.
GeoGebra Commands & Parameters
Point(c) → APoint(c) → BLine(A, B) → aTangent(A, c) → b,Intersect(e, d) → CSegment(C, B) → fSegment(C, A) → gSlope(a) → m_sSlope(b) → m_tPolygon(A, C, B) → poly1, b_1, a_1, c_1
AI Drawing Prompt Reference
Draw a line and a curve with two points on the curve. Connect these two points to form a secant line. Draw a tangent line at one of the points on the curve. Mark the intersection point of the tangent and secant lines. Connect this intersection point to the endpoints of the secant line to form two segments. Display the slopes of both lines and differentiate their colors. Connect the three points to form a triangle, highlighting the tangent, secant, and the triangle.
The prompt above was compiled from the original drawing commands and is for reference only.