
Quantitative Frequency Distribution Construction and Visualization
Loading the math board and drawing, please wait…
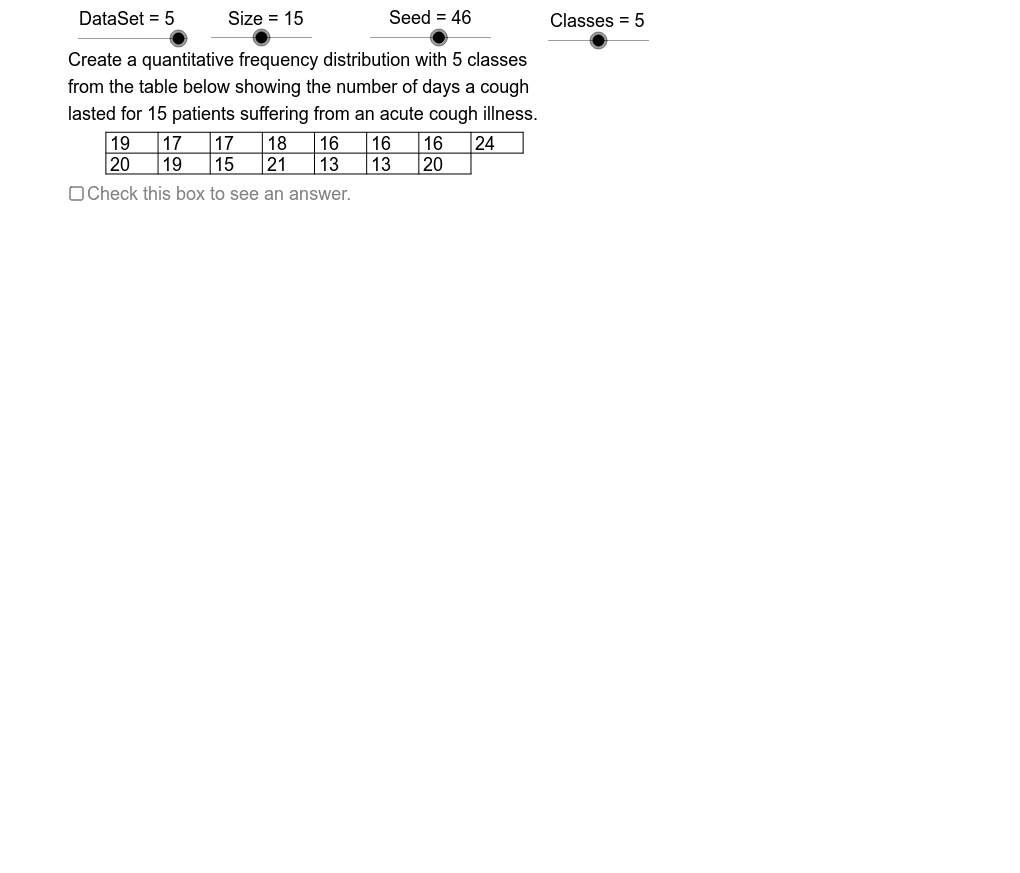
This GeoGebra applet demonstrates how to construct quantitative frequency distributions. Students can explore frequency distribution tables and histograms through checkboxes. Key mathematical concepts include frequency counting, class interval division, and statistical measures. Construction highlights: Sequence command generates data sequences, CountIf counts frequencies in each class, If performs conditional filtering, Mean calculates averages, Sort arranges data in order, Max/Min determine data range, and Polygon draws frequency distribution polygons. This example is suitable for middle school mathematics probability and statistics chapters, helping students understand frequency distribution table construction and histogram plotting methods, also useful for introductory statistics courses.
GeoGebra Commands & Parameters
Sequence(TbTp - k, k, 0, 3) → TbLHSqElement(TbLHSq, 3) → TbLH2Element(RtSq, Mod[Seed, 8] + 1) → RateSequence(Mod[(Rate * k) + Strt, 23] + 1, k, 0, 22, 1) → OpSqElement(DtSq, Data) → Dt0Sequence(Element[Dt0, Element[OpSq, k]], k, 1, Size) → SmpSqElement(TbLHSq, 1) → TbLH0Element(AcSq, Data) → AcDtMax(SmpSq) → DtMxMin(SmpSq) → DtMnIf(C0 ≤ UB, 0, If[C1 ≤ UB, 0, If[C2 ≤ UB, 1, If[C3 ≤ UB, 2, 3]]]) → AcCWMax(AcDt, AcCW) → AcCnIf(C0 ≤ UB, C0, If[C1 ≤ UB, C1, If[C2 ≤ UB, C2, If[C3 ≤ UB, C3, C4]]]) → ClWdSequence(DtMn + (k * ClWd), k, 0, NmCl - 1) → LCLElement(LCL, 2) → LCL2Sequence(UCL1 + (ClWd * k), k, 0, NmCl - 1) → UCLSequence(CountIf[Element[LCL, k] ≤ x ≤ Element[UCL, k], SmpSq], k, 1, NmCl) → FrSqMax(FrSq) → FrMxIf(FrMx > 12, 3, If[FrMx > 6, 2, 1]) → VSclElement(TbLHSq, 4) → TbLH3Element(TbLHSq, 2) → TbLH1Element(LCL, 1) → AxMnElement(PlcSq, Data) → DPSequence(k, k, 1, 23) → StrSqSequence(Element[SmpSq, k], k, 1, RwLn1) → DtRw1Sequence(Element[SmpSq, k], k, RwLn1 + 1, Size) → DtRw2Element(DDSq, Data) → DD0Mean(SmpSq) → XbarSort(SmpSq) → SrtSqCountIf(x > 0, RtSq) → RtNoElement(SclSq, Data) → ScaleSequence(If[k > 1, " + ", " "], k, 1, NmCl) → PlsSqSequence(" = ", k, 1, NmCl) → EqSqSequence(DtMn + (k * ClWd), k, 0, NmCl - 2) → LCLCn1Append(DtMn, LCLCn1) → LCLCn2Sequence(ClWd, k, 1, NmCl - 1) → CWSq1Append(" ", CWSq1) → CWSq2Sequence(UCL1 + (ClWd * k), k, 0, NmCl - 2) → UCLCn1Append(UCL1, UCLCn1) → UCLCn2Sequence("to", k, 1, NmCl) → ToSqSequence(If[Element[FrSq, j] > 0, Sequence["|", k, 1, Element[FrSq, j]], {" "}], j, 1, NmCl) → TlSqPolygon(FDUL, FDLL, FDLR, FDUR) → FDBx, fdrg, fdbt, fdlf, fdtpIf(VScl ≟ 3, (ceil(FrMx / 3) * 3), If[VScl ≟ 2, (ceil(FrMx / 2) * 2), FrMx]) → VMaxElement(LCL, 1) → LCL1Segment(TbML, TbMR) → tbmdSegment(TbLL, TbLR) → tbbtSegment(TbUL, TbUR) → tbtpSum(FrSq) → ChSzCountIf(x ≠ (0, 0), Dt0) → DtCnSequence(Text[Element[LCL, k], (17.1, CLTp - (0.9 * k))], k, 1, NmCl) → LCLTx1Sequence(Text[Element[EqSq, k], (16.1, CLTp - (0.9 * k))], k, 1, NmCl) → EqTx1Sequence(Text[Element[CWSq1, k], (14.3, CLTp - 0.9 - (0.9 * k))], k, 1, NmCl - 1) → CWTx1Sequence(Text[Element[PlsSq, k], (13.3, CLTp - (0.9 * k))], k, 1, NmCl) → PlsTx1Sequence(Text[Element[LCLCn2, k], (11.6, CLTp - (0.9 * k))], k, 1, NmCl) → LCLCnTxSequence(Text[Element[UCL, k], (26, CLTp - (0.9 * k))], k, 1, NmCl) → UCLTx1Sequence(Text[Element[EqSq, k], (25, CLTp - (0.9 * k))], k, 1, NmCl) → EqTx2Sequence(Text[Element[CWSq1, k], (23.3, CLTp - 0.9 - (0.9 * k))], k, 1, NmCl - 1) → CWTx2Sequence(Text[Element[PlsSq, k], (22.2, CLTp - (0.9 * k))], k, 1, NmCl) → PlsTx2Sequence(Text[Element[UCLCn2, k], (20.5, CLTp - (0.9 * k))], k, 1, NmCl) → UCLCnTxSequence(Segment[(TbLf + (CW * k), TbLH0), (TbLf + (CW * k), TbLH2)], k, 0, RwLn2) → TbVLnIf(Mod[Size, 2] ≟ 1, Segment[TbMR, TbUR], Segment[TbLR, TbUR]) → tbrgSequence(Text[Element[FrSq, k], (24.3, DLHt - (0.9 * k))], k, 1, NmCl) → FrTxSequence(If[Element[FrSq, j] > 0, Sequence[Text["|", (17.8 + (k * 0.3), DLHt - (0.9 * j))], k, 1, Element[FrSq, j]], Text[" ", (17.8, DLHt - (0.9 * j))]], j, 1, NmCl) → TlTxSqIf(AcCn ≠ 1, "s", "") → PlCnIf(AcDt ≠ 1, "s", "") → PlDtIf(AcCW ≠ 1, "s", "") → PlCWKeepIf(floor(23 / x) ≠ 23 / x, StrSq) → RlPrSqSequence(Text[Element[DtRw1, k], (TbLf - 2.3 + (k * CW), TbLH1 + 0.15)], k, 1, RwLn1) → TxRw1Sequence(Text[Element[DtRw2, k], (TbLf - 2.3 + (k * CW), TbLH2 + 0.15)], k, 1, RwLn2) → TxRw2Sequence(Text[Element[UCL, k], (15.8, DLHt - (0.9 * k))], k, 1, NmCl) → UCLTx2Sequence(Text[Element[ToSq, k], (14.7, DLHt - (0.9 * k))], k, 1, NmCl) → ToTxSequence(Text[Element[LCL, k], (12.2, DLHt - (0.9 * k))], k, 1, NmCl) → LCLTx2
AI Drawing Prompt Reference
Draw a quantitative frequency distribution table and its histogram. Generate a random sample dataset, compute its range, and determine class width and number of classes. Mark class boundaries with vertical lines, count frequencies per class, and plot a histogram with bar heights proportional to frequencies, adjusting the vertical scale for clarity. Display the frequency table with class intervals, frequencies, and cumulative frequencies, using checkboxes to toggle table and graph visibility.
The prompt above was compiled from the original drawing commands and is for reference only.