
Quadratic Inequalities Self-Test: Interactive Graphing with Color Feedback
Loading the math board and drawing, please wait…
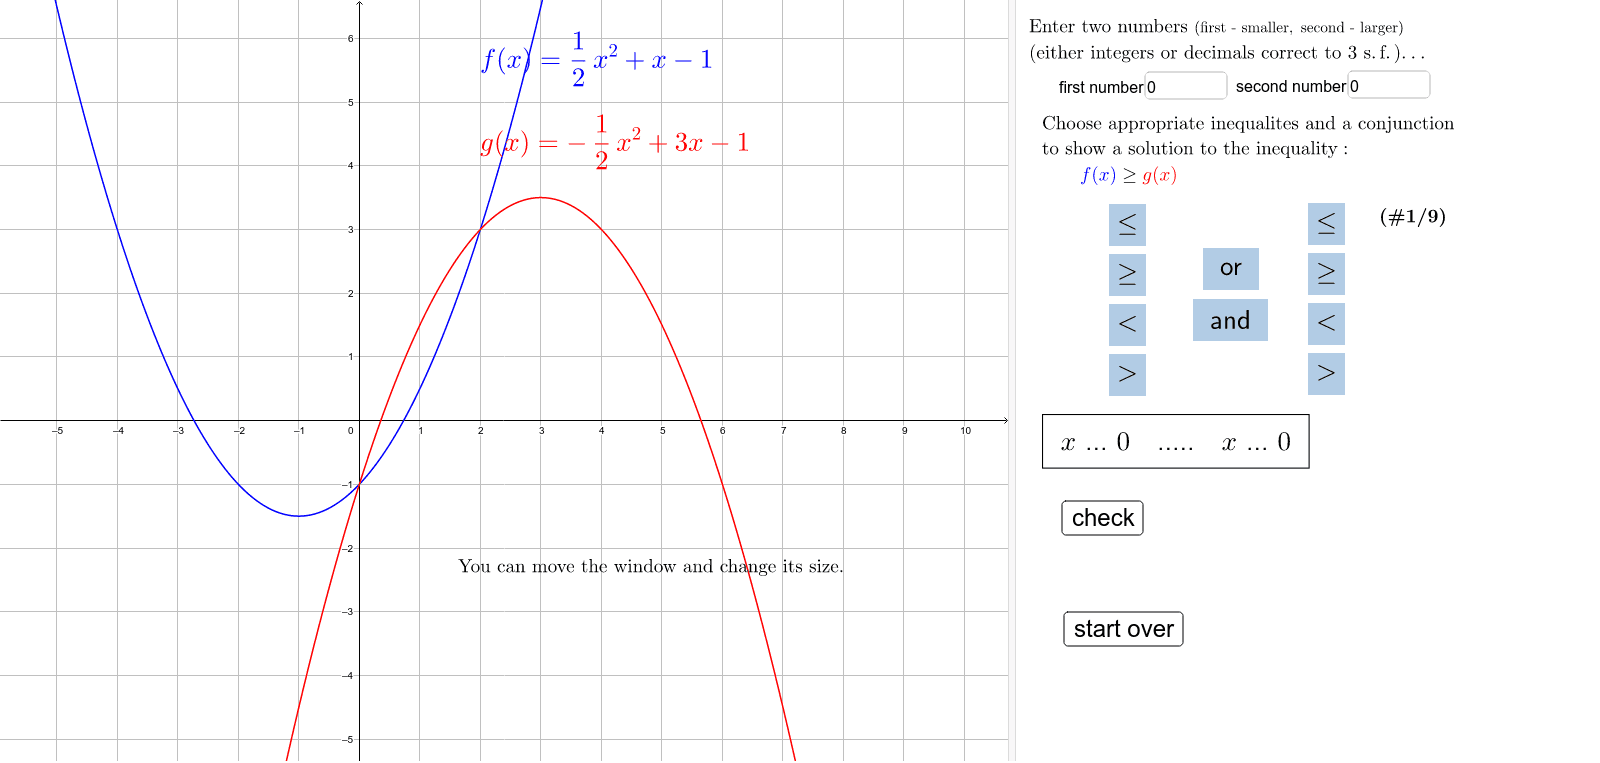
① This interactive GeoGebra example serves as a self-test for quadratic inequalities, allowing users to input coefficients and constants to dynamically see the corresponding quadratic function graph and the shaded solution regions, with immediate feedback. ② Core mathematical concepts include quadratic functions, quadratic inequalities, interval notation on the number line, discriminant and root relationships, and the geometric interpretation of solution sets. ③ Construction highlights: commands such as Element, Textfield, Length, and Polygon are used to create text input fields and dynamic polygon regions; objects include text1 through text8, ineq1, ineq2, and numerous color objects (e.g., colorineq11R, colorineq12B) to distinguish shaded regions for different inequalities; conditional logic via textcon1, textcon2, and context provides feedback. ④ Suitable for high school students practicing quadratic inequalities independently, or for teachers demonstrating in class and for after-class self-assessment, helping learners intuitively connect solution sets with graphs.
GeoGebra Commands & Parameters
Element(intext1, ineq1 + 1) → intext1elElement(intext1, ineq2 / 10 + 1) → intext2elTextfield(a) → InputBox1Element(Element[problem, prnr], 1) → ineqdispElement(Element[problem, prnr], 3) → fElement(Element[problem, prnr], 5) → gElement(Element[problem, prnr], 2) → fformulaElement(Element[problem, prnr], 4) → gformulaTextfield(b) → InputBox2Element(context, con / 100 + 1) → contextElLength(problem) → lengthPolygon(Corner[1], Corner[2], Corner[3], Corner[4]) → poly1, c, d, e, h
AI Drawing Prompt Reference
Create an interactive graphing interface for self-testing quadratic inequalities. The main view shows a parabola representing a quadratic function, along with a number line where two inequality solution sets are shaded in distinct colors (e.g., red and blue). Two text input fields are placed nearby for entering the quadratic coefficient and constant term, causing the parabola and shaded regions to update dynamically. Below the graph, display the current inequality and function formulas as text, with feedback indicating whether the input is correct. All elements are arranged within a rectangular background area.
The prompt above was compiled from the original drawing commands and is for reference only.