
Visualizing Linear and Quadratic Inequalities (IF4-02-XT1)
Loading the math board and drawing, please wait…
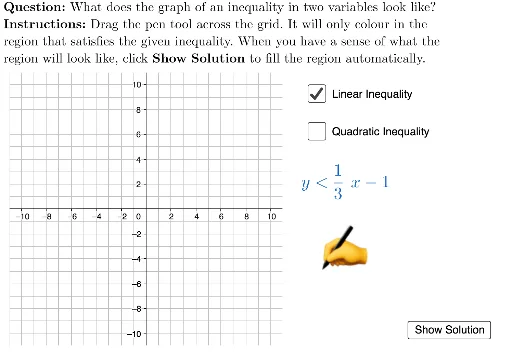
This interactive GeoGebra example dynamically visualizes linear and quadratic inequalities on the coordinate plane, helping learners grasp the geometric meaning of solution sets. Core mathematical concepts include linear functions, quadratic functions, inequality regions, boundary lines (solid/dashed), and how parameter changes affect the solution region. Construction highlights: uses the Polygon command to build visible regions, LaTeX for mathematical notation, sliders (showLinear, showQuadratic) to toggle inequality types, animation commands (linearInequalityAnimate, quadraticInequalityAnimate) to show boundary movement, a random experiment button (TryAnother) to generate new problems, hidden objects (hiddenLinearInequality, hiddenQuadraticInequality) for stepwise reveals, and pen tools (penTip, penOn) for freehand annotation. Suitable for high school or introductory college students exploring inequality concepts, and for teachers demonstrating the connection between algebra and geometry in classroom settings.
GeoGebra Commands & Parameters
Polygon({(-11, -11), (-11, 11), (11, 11), (11, -11)}) → viewBoxLaTeX((((("\text{" * QUESTION) * "\\") * INSTRUCTIONS) * "}")) → TEXTLaTeX(If[showLinear, linearInequality, quadraticInequality]) → theInequality
AI Drawing Prompt Reference
Visualize linear and quadratic inequalities on a coordinate plane with dynamic regions and boundary lines that change between solid and dashed based on inequality type, toggleable via sliders, animated boundary movements, a random problem generator, stepwise reveals using hidden objects, and freehand annotation capabilities.
The prompt above was compiled from the original drawing commands and is for reference only.