
Marked Price, Selling Price, Cost, Discount, Profit/Loss Diagram
Loading the math board and drawing, please wait…
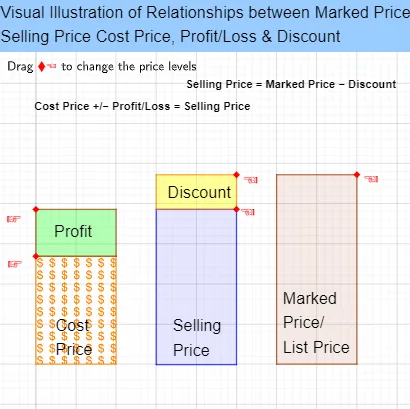
① This GeoGebra example provides a visual classroom tool to illustrate the relationships among marked price, selling price, cost price, discount, and profit/loss in commercial transactions. ② Core mathematical concepts include percentage calculations, discount and markup, profit/loss determination, and the proportional or linear connections between these quantities. ③ Construction details: Based on the summary, the model uses Point and Polygon commands to create multiple points (A, B, C, D, etc.) and polygons (q1, q2, q3), along with variables (a, b, c, d, etc.) and a text object (text1), likely incorporating sliders or input fields to dynamically adjust values and update the diagram and computed results in real time. ④ Suitable for middle school mathematics (e.g., grades 7-8) units on percentage applications or business math, as well as for teacher demonstrations in introductory economics, helping students grasp how price changes affect profit or loss.
GeoGebra Commands & Parameters
Point(eq2) → BPolygon(A, B, C, D) → q1, a, b, c, dPoint(eq1) → A_1Polygon(A_1, B_1, C_1, D_1) → q1_1, a_1, b_1, c_1, d_1Point(eq3) → B_2Point(eq1) → EPolygon(A_2, B_2, C_2, D_2) → q2, f, g, h, iPolygon(A_1, B_1, F, E) → q3, j, k, f_1, ePoint(eq2) → HPolygon(G, H, B, A) → q4, g_1, h_1, b_2, a_2
AI Drawing Prompt Reference
Create a diagram for business math teaching, showing three interconnected rectangles representing marked price, selling price, cost, discount, and profit/loss. Each rectangle is formed by four vertices, with sliders or input fields to adjust values dynamically. Include multiple polygons, some overlapping or adjacent, to illustrate proportional and linear relationships among these quantities. Add a text object displaying real-time computed results like discount percentage or profit amount. The layout should be clear for classroom demonstration, helping understand how price changes affect profit or loss.
The prompt above was compiled from the original drawing commands and is for reference only.