
Quadratic Functions Exploration
Loading the math board and drawing, please wait…
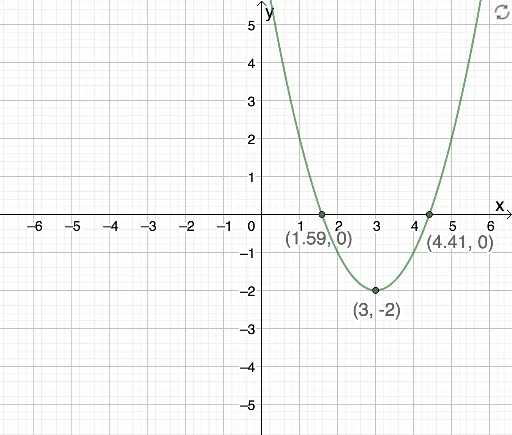
This example demonstrates the graph of quadratic functions and their transformation rules. It involves core math concepts like functions, quadratic functions, translation, extremum points, upper and lower sums or Riemann sums, centroid or barycenter, and ratios. The construction uses GeoGebra commands Root (to find roots) and Extremum (to find extrema) on function f, with objects A, B, C involved. Suitable for high school mathematics teaching, focusing on function graph transformations and property exploration.
GeoGebra Commands & Parameters
Root(f) → A, BExtremum(f) → C
AI Drawing Prompt Reference
Draw the graph of a quadratic function and find its roots and extremum point. First, draw the graph of the quadratic function, then find the two roots of the function and mark them as points A and B; next, find the extremum point of the function and mark it as point C.
The prompt above was compiled from the original drawing commands and is for reference only.