
Quadratic Functions and Geometric Transformations
Loading the math board and drawing, please wait…
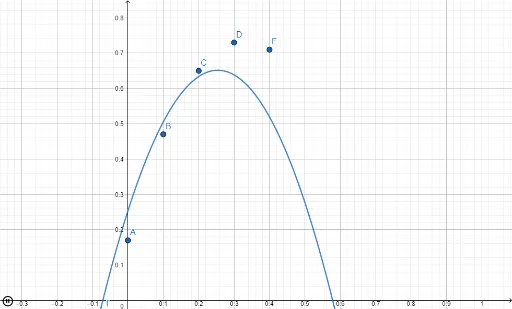
This example demonstrates the geometric transformations of quadratic function graphs and their relationship with rhombuses and unit circles. Key math concepts include quadratic functions, geometric transformations (translation), rhombus properties, unit circle, and standard deviation (shown via boxplot). Construction highlights involve GeoGebra commands/objects A, B, C, D, E, a, b, c, f for point, line, and shape creation/transformation. Suitable for high school mathematics education to understand the intrinsic connection between function transformations and geometric figures.
GeoGebra Commands & Parameters
(0, 0.17)(0.1, 0.47)(0.2, 0.65)(0.3, 0.73)(0.4, 0.71)Numeric a(-6.175)Numeric b(3.15)Numeric c(0.25)f(x) = (a * x^(2)) + (b * x) + c
AI Drawing Prompt Reference
Draw a quadratic function graph and demonstrate its geometric transformations, including translations, showing the relationship with rhombuses and unit circles. Include several key points to draw lines, and label the properties of the rhombus and the unit circle. Also, use a boxplot to display standard deviation. The entire graph should illustrate the intrinsic connection between function transformations and geometric figures, suitable for high school mathematics education.
The prompt above was compiled from the original drawing commands and is for reference only.