
Quadratic Function Graph with Roots and Vertex
Loading the math board and drawing, please wait…
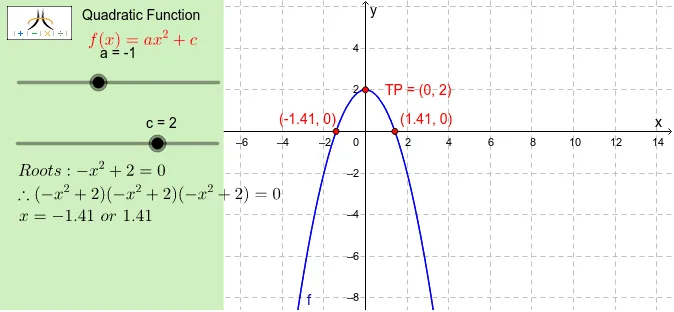
① This GeoGebra example dynamically plots a quadratic function based on given parameters and highlights its roots (x-intercepts). ② Core mathematical concepts include the standard form of a quadratic, completing the square, vertex (extremum), factorization, and the geometric meaning of roots as intersections with the x-axis. ③ Construction details: uses commands such as CompleteSquare to convert to vertex form, Extremum to find the vertex, Root to compute roots, Factors for factorization, and Polygon/Corner to build a control panel and frame; sliders for parameters a and c allow real-time adjustment, while text objects display the roots, vertex, and factored form. ④ Suitable for middle and high school mathematics, this example helps students understand quadratic properties, graph transformations, root-finding methods, and the technique of completing the square, and serves as an interactive classroom demonstration or self-study tool.
GeoGebra Commands & Parameters
CompleteSquare(f) → CompSqExtremum(f) → TPRoot(f) → xints_1, xints_2Factors(f) → fctrsElement(fctrs, 1, 1) → fctr1Element(fctrs, 2, 1) → fctr2Element(fctrs, 3, 1) → fctr3Corner(1, 1) → Cnr1Corner(1, 2) → Cnr2Corner(1, 3) → Cnr3Corner(1, 4) → Cnr4Polygon(CN1, CN2, CN3, CN4) → Panel, cn1, cn2, cn3, cn4Polygon(Cnr1, Cnr2, Cnr3, Cnr4) → Frame, cnr1, cnr2, cnr3, cnr4
AI Drawing Prompt Reference
Draw a quadratic function graph with adjustable parameters, showing its two x-intercepts (roots) and its vertex (maximum or minimum point). Highlight the axis of symmetry with a dashed line. Display text boxes near the graph showing the vertex form, factored form, and the numeric values of the roots. In a corner of the canvas, place a control panel with two sliders to adjust the leading coefficient and the constant term; as the sliders move, the graph, roots, vertex, and displayed expressions update in real time. Enclose the entire graph in a rectangular frame, and also put the control panel inside its own rectangular border for a clean layout.
The prompt above was compiled from the original drawing commands and is for reference only.