
Quadratic Function Graph in Completed Square Form
Loading the math board and drawing, please wait…
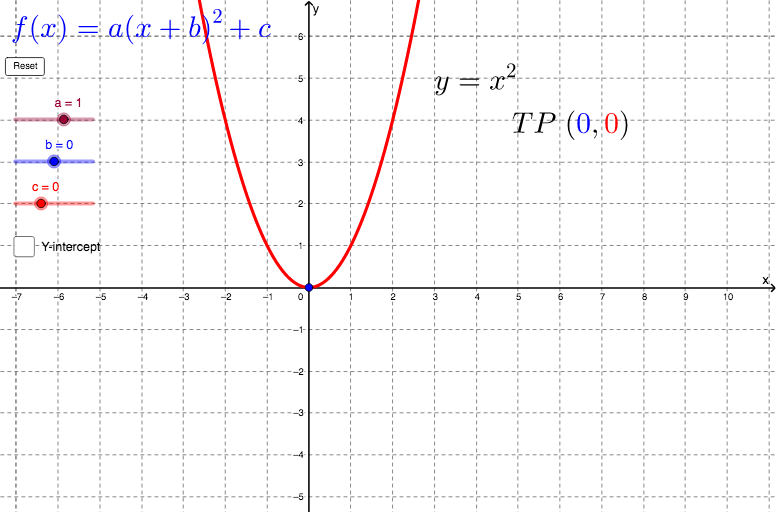
This example demonstrates how to draw the graph of a quadratic function in completed square form. Key mathematical concepts include quadratic functions, vertex coordinates, and the axis of symmetry. GeoGebra commands used include If, Function, and Intersect. Suitable for high school mathematics education and learning quadratic function graph transformations.
GeoGebra Commands & Parameters
If(b ≤ 0, "-", "") → signbIf(c < 0, "-", "") → signcIf(c < 0, "-", "+") → signccIf(b < 0, "-", "+") → signbbFunction((a * (x + b)^(2)) + c, -30, 30) → fIf(b ≤ 0, "", "-") → signb_NIf(a ≠ 1 ∧ a ≠ 0, "" + a, "") → valueaIntersect(f, yAxis) → B
AI Drawing Prompt Reference
Draw the graph of a quadratic function in completed square form, showing the vertex coordinates and axis of symmetry, with the graph ranging from x = -30 to x = 30. Determine the direction of the parabola's opening and the vertex position based on the function's coefficients. First, plot the function graph, then find the intersection point with the y-axis.
The prompt above was compiled from the original drawing commands and is for reference only.