
Properties of Diagonal Lines
Loading the math board and drawing, please wait…
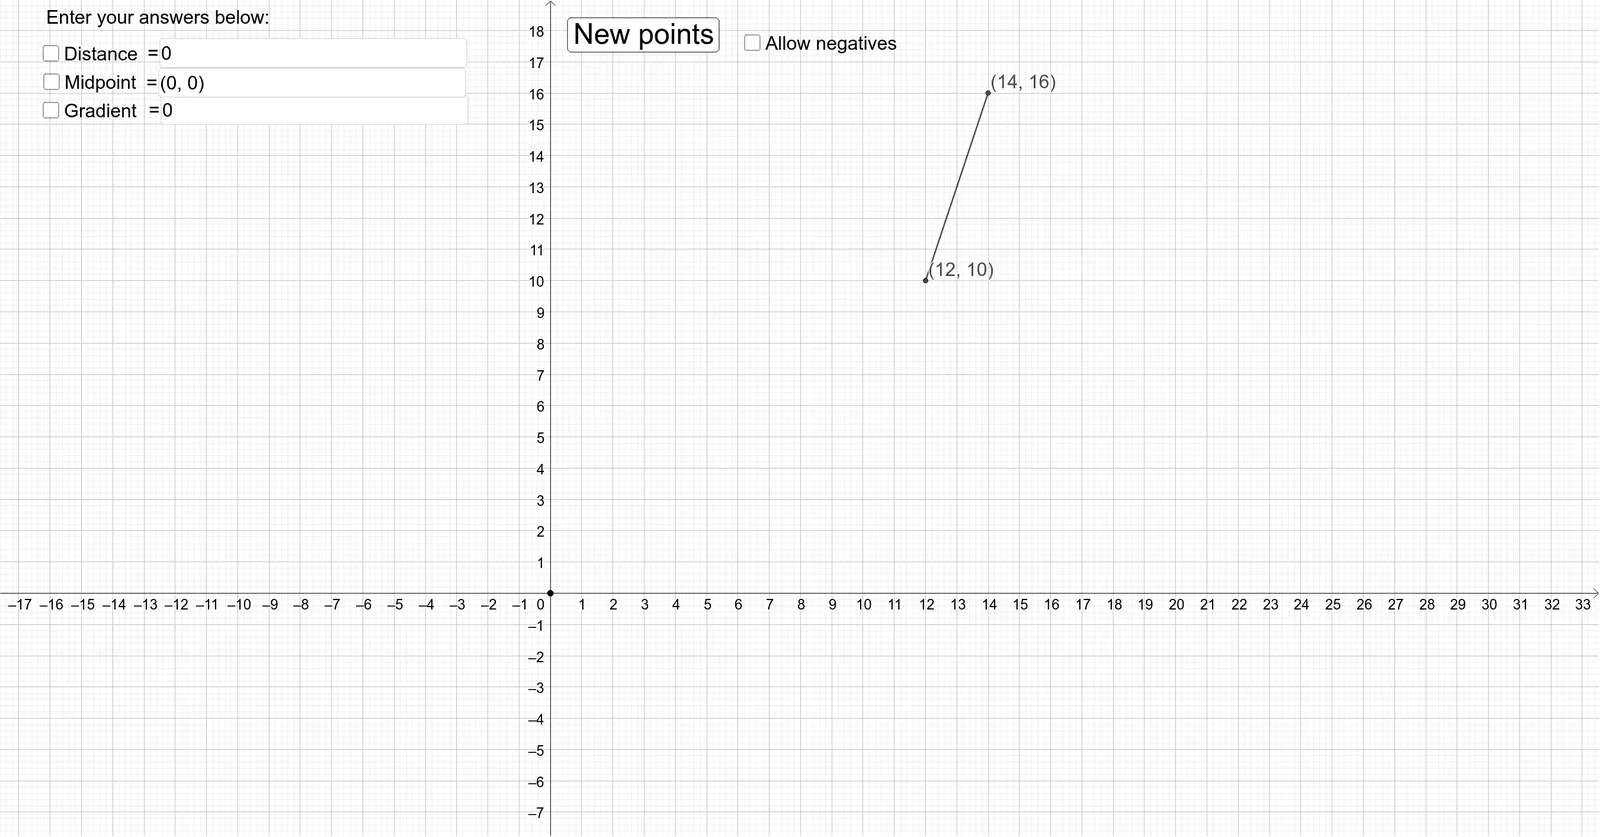
This example demonstrates calculating the gradient, distance, and midpoint for a pair of points in Cartesian coordinates. It involves core math concepts like slope calculation, distance formula (Pythagorean Theorem), midpoint coordinate formula, and line segment properties. Constructed using GeoGebra commands/objects: If, Segment, Slope, Midpoint, Textfield. Suitable for middle school and above students learning coordinate geometry to understand basic line segment properties and calculation methods.
GeoGebra Commands & Parameters
If(d, -10, 0) → lowSegment(P, Q) → fSlope(f) → mMidpoint(f) → MSegment(Q, P) → gTextfield(ansD) → InputBox1Textfield(ansG) → InputBox3Textfield(AM) → InputBox2If(d, P = (Random[-10, 20], Random[-10, 18]), P = (Random[0, 20], Random[0, 18])) → eIf(d, P = (Random[-10, 20], Random[-10, 18]), P = (Random[0, 20], Random[0, 18])) → hIf(d, P = (Random[-10, 20], Random[-10, 18]), P = (Random[0, 20], Random[0, 18])) → iIf(d, P = (Random[-10, 20], Random[-10, 18]), P = (Random[0, 20], Random[0, 18])) → jIf(d, P = (Random[-10, 20], Random[-10, 18]), P = (Random[0, 20], Random[0, 18])) → kIf(d, P = (Random[-10, 20], Random[-10, 18]), P = (Random[0, 20], Random[0, 18])) → lIf(d, P = (Random[-10, 20], Random[-10, 18]), P = (Random[0, 20], Random[0, 18])) → nIf(d, P = (Random[-10, 20], Random[-10, 18]), P = (Random[0, 20], Random[0, 18])) → oIf(d, P = (Random[-10, 20], Random[-10, 18]), P = (Random[0, 20], Random[0, 18])) → pIf(d, P = (Random[-10, 20], Random[-10, 18]), P = (Random[0, 20], Random[0, 18])) → qIf(d, P = (Random[-10, 20], Random[-10, 18]), P = (Random[0, 20], Random[0, 18])) → rIf(d, P = (Random[-10, 20], Random[-10, 18]), P = (Random[0, 20], Random[0, 18])) → sIf(d, P = (Random[-10, 20], Random[-10, 18]), P = (Random[0, 20], Random[0, 18])) → tIf(d, P = (Random[-10, 20], Random[-10, 18]), P = (Random[0, 20], Random[0, 18])) → uIf(d ≟ true, P = (Random[-10, 20], Random[-10, 18]), P = (Random[0, 20], Random[0, 20])) → vIf(d ≟ true, P = (Random[-10, 20], Random[-10, 18]), P = (Random[0, 20], Random[0, 20])) → wIf(d ≟ true, P = (Random[-10, 20], Random[-10, 18]), P = (Random[0, 20], Random[0, 20])) → a_1If(d ≟ true, P = (Random[-10, 20], Random[-10, 18]), P = (Random[0, 20], Random[0, 20])) → b_1If(d ≟ true, P = (Random[-10, 20], Random[-10, 18]), P = (Random[0, 20], Random[0, 20])) → c_1If(d ≟ true, P = (Random[-10, 20], Random[-10, 18]), P = (Random[0, 20], Random[0, 20])) → d_1If(d ≟ true, P = (Random[-10, 20], Random[-10, 18]), P = (Random[0, 20], Random[0, 20])) → e_1If(d ≟ true, P = (Random[-10, 20], Random[-10, 18]), P = (Random[0, 20], Random[0, 20])) → f_1If(d ≟ true, P = (Random[-10, 20], Random[-10, 18]), P = (Random[0, 20], Random[0, 20])) → g_1
AI Drawing Prompt Reference
Draw two line segments, calculate and display their slopes, midpoints, and lengths, with text boxes labeling the results. Start by drawing the segments, then calculate and annotate the properties, suitable for middle school students learning coordinate geometry to understand basic line segment properties and calculation methods.
The prompt above was compiled from the original drawing commands and is for reference only.