
Probability Tree Diagram Exercise
Loading the math board and drawing, please wait…
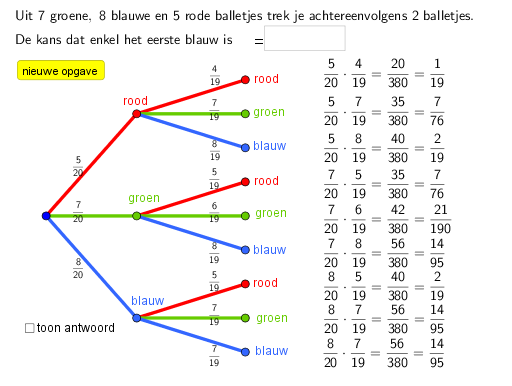
This example demonstrates how to use a tree diagram to calculate probabilities. Key math concepts include probability and statistics. Construction highlights include the use of Random, If, Segment, Textfield, and FractionText commands. Suitable for middle school and above students learning probability and statistics.
GeoGebra Commands & Parameters
Random(1, 3) → kkRandom(4, 8) → blauwRandom(3, 8) → groenIf(kk ≟ 1, kk1, If[kk ≟ 2, kk2, kk3]) → tellerSegment(A, R) → aSegment(A, V) → bSegment(A, B) → cSegment(R, G) → hSegment(V, K) → kSegment(B, O) → nSegment(R, I) → iSegment(R, J) → jSegment(B, Q) → pSegment(B, S) → qSegment(V, M) → lSegment(V, N) → mTextfield(leeg) → Invulvak1FractionText(opl) → tekstoplIf(kk ≟ 1, "groen", If[kk ≟ 2, "blauw", "rood"]) → tekstwelk
AI Drawing Prompt Reference
Draw a probability tree diagram with three initial event nodes A, R, and V. From A, there are two branches leading to R and V. From R, there are two branches leading to G and I. From V, there are two branches leading to K and M. Each node represents a random event with outcomes of green, blue, or red, determined by a random number generator.
The prompt above was compiled from the original drawing commands and is for reference only.