
Probability simulation: The cost of an ice cream
Loading the math board and drawing, please wait…
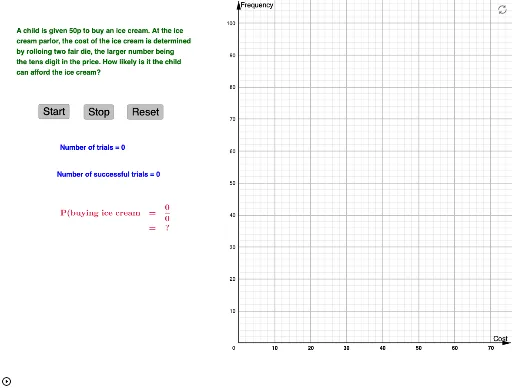
This example demonstrates how to analyze the distribution of ice cream costs through probability simulation. Key math concepts include Probability & Statistics, Normal Distribution, Rhombus, General Quadrilateral, Power Functions, and Line Segment. Construction highlights involve commands like Random, DotPlot, CountIf, and Length, along with objects such as d_1, d_2, n, cost, data, etc. Suitable for high school students learning probability statistics and data analysis.
GeoGebra Commands & Parameters
Random(1, 6) → d_1Random(1, 6) → d_2DotPlot(data) → l1CountIf(x < 50, data) → aLength(data) → b