
Probability of Intervals of Normal Distributions
Loading the math board and drawing, please wait…
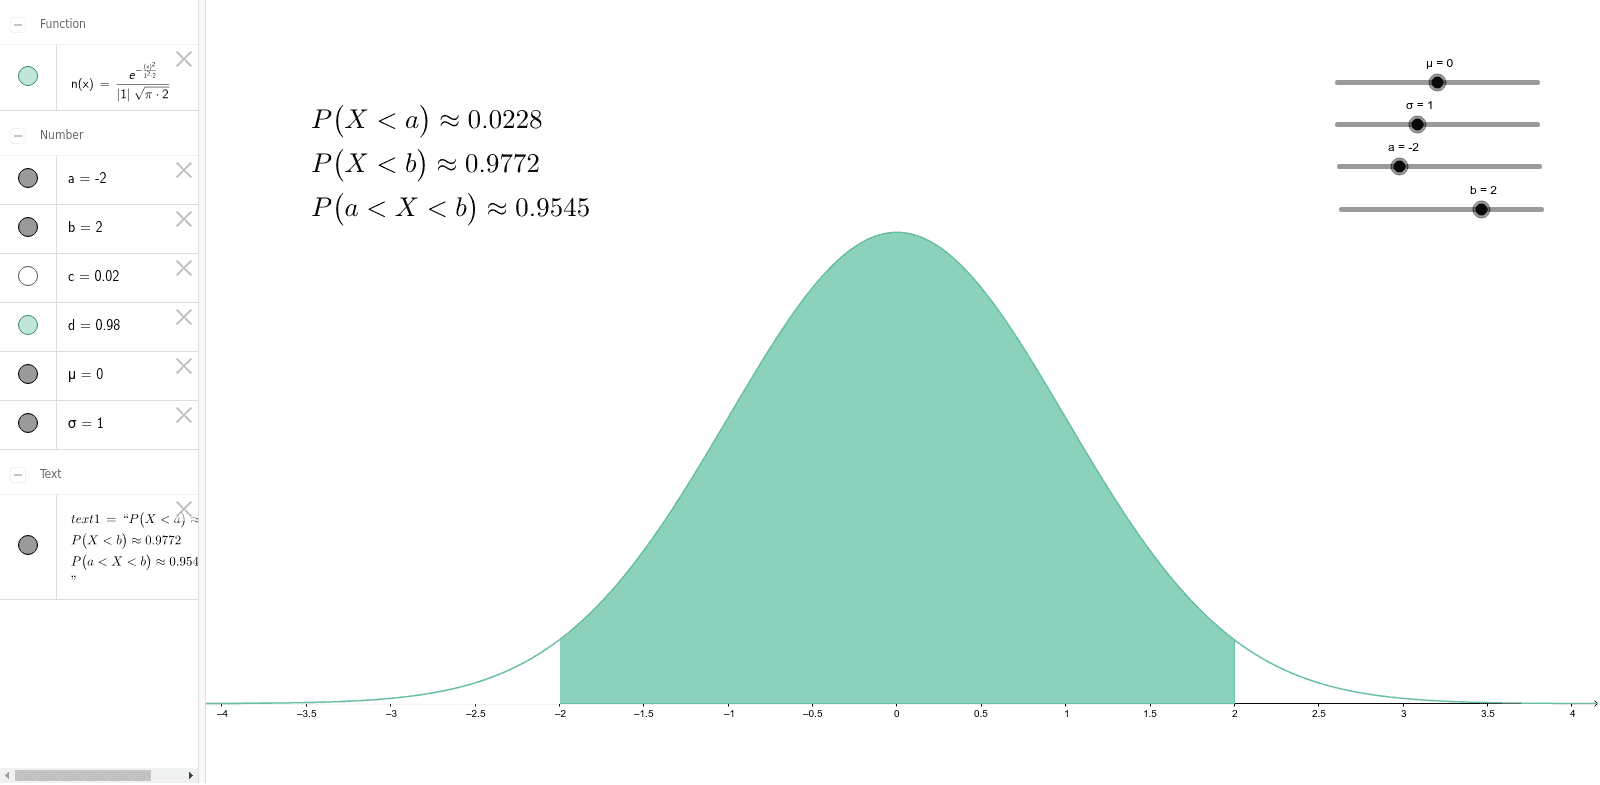
This example demonstrates the calculation and visualization of probabilities within different intervals of a normal distribution. Key math concepts include normal distribution, probability density function, and integral calculations. It uses GeoGebra commands like Normal for plotting the distribution and Integral for computing area under the curve, with objects such as μ (mean), σ (standard deviation), n (distribution parameter), a, b (interval endpoints), d, c (auxiliary variables), and text1 (text annotations). Suitable for high school students and learners needing foundational knowledge in probability & statistics.
GeoGebra Commands & Parameters
Normal(μ, σ, x) → nIntegral(n, -100, b) → dIntegral(n, -100, a) → c
AI Drawing Prompt Reference
Draw a normal distribution curve and mark two intervals a and b. Calculate and display the area within these intervals, using auxiliary lines to represent the integral results. Label the mean and standard deviation. Start by drawing the normal distribution curve, then mark the intervals a and b, calculate and display the areas, and finally use auxiliary lines to represent the integral results, labeling the mean and standard deviation.
The prompt above was compiled from the original drawing commands and is for reference only.