
Compare Normal Distribution Densities
Loading the math board and drawing, please wait…
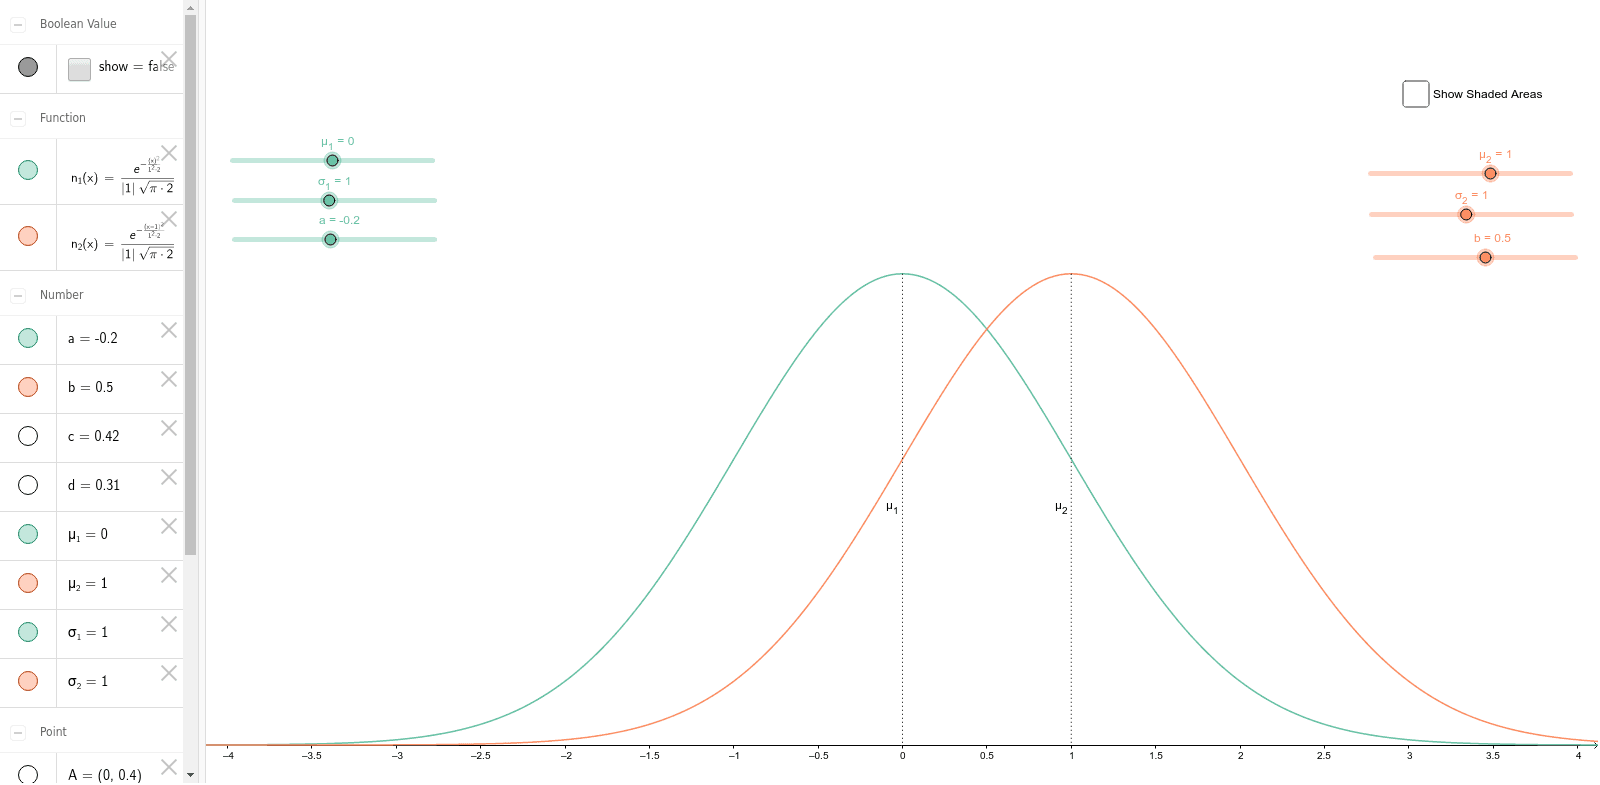
This example demonstrates how to plot and compare two normal distribution density curves. Normal distribution is a key concept in probability theory, defined by its mean μ and standard deviation σ. The construction involves using GeoGebra commands like Normal, Segment, and Integral to create the curves, and adjusting parameters to show density variations. Suitable for high school students or college students learning probability statistics and data analysis.
GeoGebra Commands & Parameters
Normal(μ_1, σ_1, x) → n_1Normal(μ_2, σ_2, x) → n_2Segment(A, B) → s_aSegment(C, D) → s_bIntegral(n_1, -100, a) → cIntegral(n_2, -100, b) → d
AI Drawing Prompt Reference
Plot two normal distribution probability density curves with different mean and standard deviation parameters to visually compare their shapes. Show shaded integral areas under each curve from -100 to specific points representing cumulative probability distributions. Include two auxiliary line segments connecting key points to aid understanding of the distribution characteristics.
The prompt above was compiled from the original drawing commands and is for reference only.