
Probability Example by sciencereimer
Loading the math board and drawing, please wait…
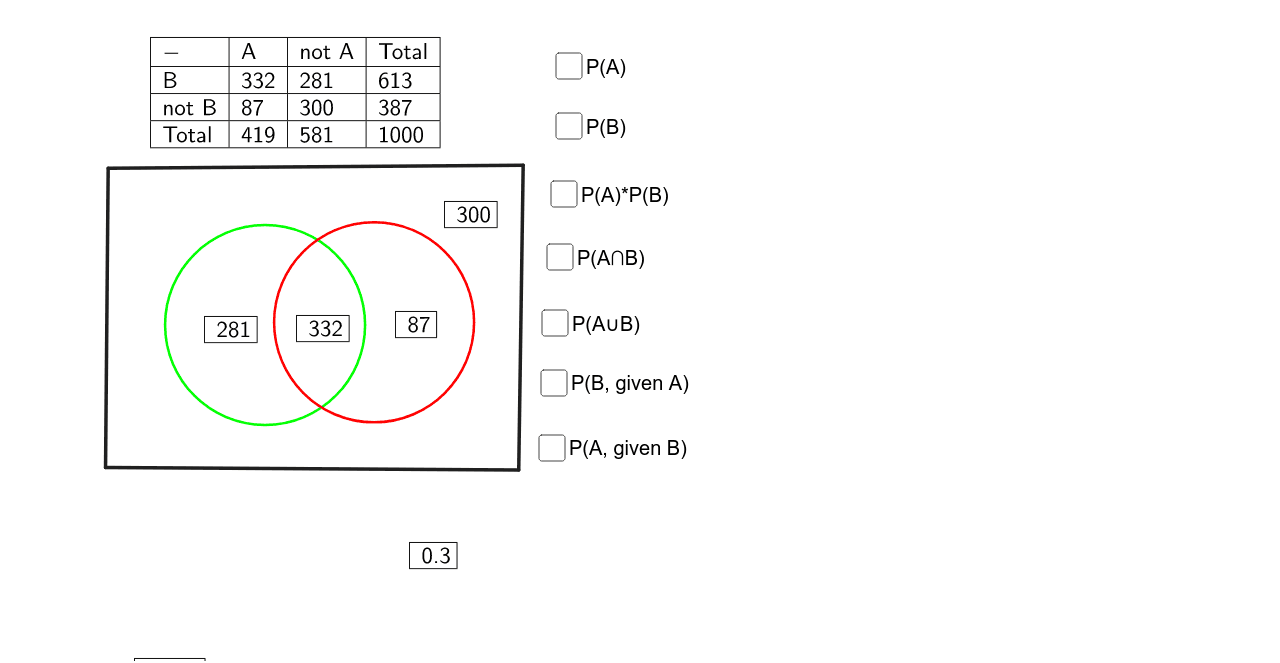
This example demonstrates probability and geometric probability models in statistics. Core math concepts include probability calculation, area measurement, 2D vectors, and geometric transformations. It utilizes GeoGebra commands like Random, Circle, Area, PointIn, Polygon, and TableText as per the construction summary. Suitable for high school students learning probability and geometric transformations.
GeoGebra Commands & Parameters
Random(200, 400) → C3Random(200, 400) → D3Random(50, 100) → C4Circle(M, 2) → cCircle(N, 2) → dArea(d) → aPointIn(d) → PointdPolygon(C, D, E, F) → poly1, c_1, d_1, e, fTableText({{C3}}, "|_") → text1TableText({{D3}}, "|_") → text2TableText({{C4}}, "|_") → text3TableText({{D4}}, "|_") → text4TableText({{C8}}, "|_") → text5TableText({{D8}}, "|_") → text6TableText({{E8}}, "|_") → text7TableText({{F8}}, "|_") → text8Random(200, 400) → C3_1Random(50, 100) → C4_1Random(200, 400) → C3_2Random(50, 100) → C4_2Random(200, 400) → C3_3Random(200, 400) → C3_4Random(200, 400) → D3_1TableText({{B2, C2, D2, E2}, {B3, C3, D3, E3}, {B4, C4, D4, E4}, {B5, C5, D5, E5}}, "|_") → text10Random(200, 400) → C3_5Random(200, 400) → D3_2
AI Drawing Prompt Reference
Create a statistical probability and geometric probability model example with two randomly generated circles, measure the area of one circle, and display the values of these random numbers. Then, construct a polygon and generate a random point inside one of the circles. Finally, show multiple randomly generated value tables to illustrate the process of probability calculation and geometric transformations.
The prompt above was compiled from the original drawing commands and is for reference only.