
Tree Diagram by sciencereimer
Loading the math board and drawing, please wait…
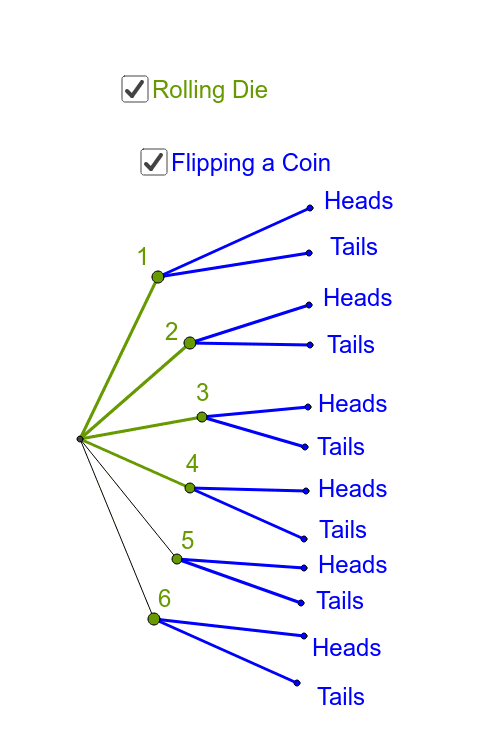
This example demonstrates the construction of a tree diagram, illustrating the concept of conditional probability. Using GeoGebra commands such as Segment and Intersect, various branches of the tree diagram are constructed. Suitable for students at the junior high school level and above to learn about probability and statistics.
GeoGebra Commands & Parameters
Segment(A_1, A) → aSegment(A_1, B) → bSegment(A, Heads) → cSegment(A, C) → dSegment(B, H) → iSegment(B, I) → jSegment(Heads, B_1) → eSegment(Heads, D) → fSegment(C, E) → gSegment(C, F) → hSegment(H, G) → kSegment(H, J) → lSegment(I, K) → mSegment(I, L) → nIntersect(a, b) → MSegment(M, N) → qSegment(M, O) → rSegment(M, P) → sSegment(M, Q) → tSegment(N, R) → a_1Segment(N, S) → b_1Segment(O, T) → c_1Segment(O, U) → d_1Segment(P, V) → e_1Segment(P, W) → f_1Segment(Q, Z) → g_1Segment(Q, C_1) → h_1
AI Drawing Prompt Reference
Draw a tree diagram to illustrate the concept of conditional probability, featuring multiple branches extending from a central point in four directions, each main branch further splitting into two sub-branches, resulting in eight endpoints. Start by drawing the central point and four main branches, then extend two sub-branches from each main branch, and finally connect all branches to form a complete tree structure.
The prompt above was compiled from the original drawing commands and is for reference only.