
Probability Example by sciencereimer (2)
Loading the math board and drawing, please wait…
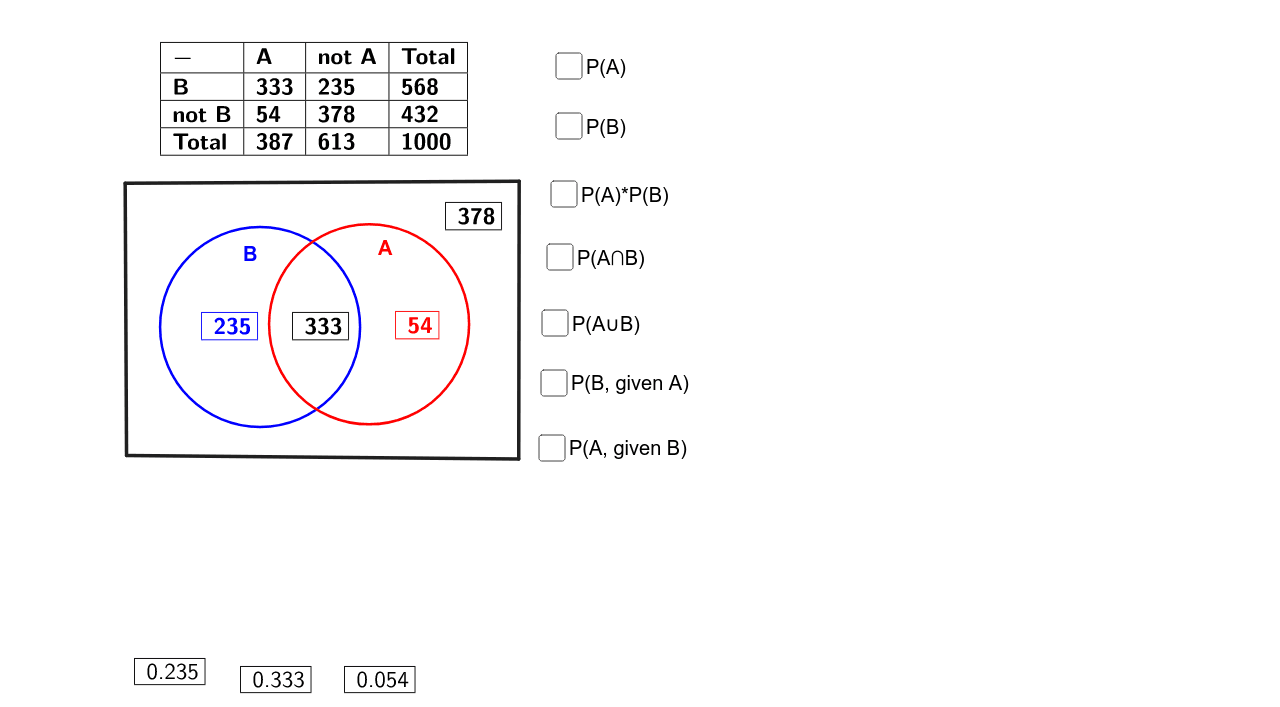
This example demonstrates basic probability concepts, including probability calculations for random events. It uses GeoGebra commands such as Random, Circle, Area, PointIn, Polygon, and TableText. Suitable for high school mathematics, particularly probability and statistics courses.
GeoGebra Commands & Parameters
Random(200, 400) → C3Random(200, 400) → D3Random(50, 100) → C4Circle(M, 2) → cCircle(N, 2) → dArea(d) → aPointIn(d) → PointdPolygon(C, D, E, F) → poly1, c_1, d_1, e, fTableText({{C3}}, "|_") → text1TableText({{D3}}, "|_") → text2TableText({{C4}}, "|_") → text3TableText({{D4}}, "|_") → text4TableText({{C8}}, "|_") → text5TableText({{D8}}, "|_") → text6TableText({{E8}}, "|_") → text7Random(200, 400) → C3_1Random(50, 100) → C4_1Random(200, 400) → C3_2Random(50, 100) → C4_2Random(200, 400) → C3_3Random(200, 400) → C3_4Random(200, 400) → D3_1TableText({{B2, C2, D2, E2}, {B3, C3, D3, E3}, {B4, C4, D4, E4}, {B5, C5, D5, E5}}, "|_") → text10Random(200, 400) → C3_5Random(200, 400) → D3_2
AI Drawing Prompt Reference
Create a probability example diagram with two randomly generated circles c and d, calculate the area a of circle d, and randomly generate a point inside circle d. Then, draw a quadrilateral with vertices formed by four randomly generated points C, D, E, and F. Finally, display four random numbers C3, D3, C4, and D4 and show them in a table.
The prompt above was compiled from the original drawing commands and is for reference only.