
Statistic Histogram & Linear Regression Demo
Loading the math board and drawing, please wait…
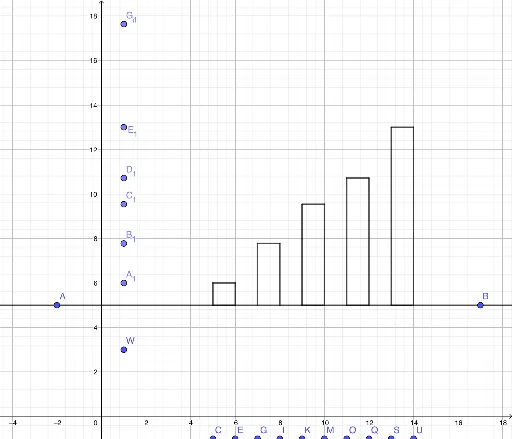
This example demonstrates the construction of a statistical histogram and its correlation with linear regression. Key math concepts include data distribution, frequency histograms, linear regression equations, and correlation coefficients. It uses commands like Line, Point, Intersect, Segment to build data points, regression lines, and auxiliary segments, making it suitable for high school mathematics education on data analysis and statistical modeling basics.
GeoGebra Commands & Parameters
Line(A, B) → fLine(C, D) → gLine(E, F) → hLine(G, H) → iLine(I, J) → jLine(K, L) → kLine(M, N) → lLine(O, P) → mLine(Q, R) → nLine(S, T) → pLine(U, V) → qLine(W, Z) → rPoint(r) → A_1Point(r) → B_1Point(r) → C_1Point(r) → D_1Point(r) → E_1Point(r) → F_1Point(r) → G_1Line(A_1, f) → sLine(B_1, f) → tLine(C_1, f) → aLine(D_1, f) → bLine(E_1, f) → cLine(F_1, f) → dLine(G_1, f) → eIntersect(g, f) → H_1Intersect(g, s) → I_1Intersect(f, h) → J_1Intersect(s, h) → K_1Intersect(i, f) → L_1Intersect(j, f) → M_1Intersect(i, t) → N_1Intersect(j, t) → O_1Intersect(k, f) → P_1Intersect(l, f) → Q_1Intersect(k, a) → R_1Intersect(l, a) → S_1Intersect(f, m) → T_1Intersect(n, f) → U_1Intersect(m, b) → V_1Intersect(n, p) → W_1Intersect(f, p) → Z_1Intersect(f, q) → A_2Intersect(n, b) → B_2Intersect(p, c) → C_2Intersect(q, c) → D_2Segment(I_1, K_1) → f_1Segment(K_1, J_1) → g_1Segment(I_1, H_1) → h_1Segment(H_1, J_1) → i_1Segment(N_1, L_1) → j_1Segment(N_1, O_1) → k_1Segment(O_1, M_1) → l_1Segment(R_1, P_1) → m_1Segment(S_1, Q_1) → n_1Segment(Q_1, P_1) → p_1Segment(S_1, R_1) → q_1Segment(V_1, T_1) → r_1Segment(B_2, U_1) → s_1Segment(T_1, U_1) → t_1Segment(V_1, B_2) → a_1Segment(C_2, Z_1) → b_1Segment(D_2, A_2) → c_1Segment(Z_1, A_2) → d_1Segment(C_2, D_2) → e_1Intersect(f, j_1) → E_2
AI Drawing Prompt Reference
Create a statistical histogram and linear regression demonstration, including multiple lines and points. Start by drawing several reference lines, then create points on these lines. Construct auxiliary line segments through the intersections of points and lines, and finally connect some intersection points with lines to show data distribution, frequency histograms, linear regression equations, and correlation coefficients.
The prompt above was compiled from the original drawing commands and is for reference only.