
Probability Calculator by John Rodgers
Loading the math board and drawing, please wait…
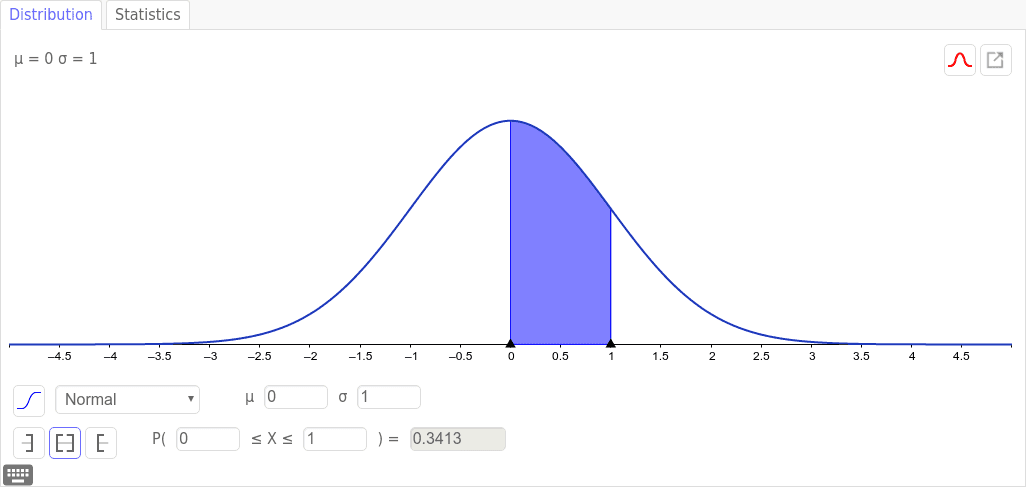
This example demonstrates how to construct a probability calculator in GeoGebra, visually displaying probability distributions. Core math concepts include Probability & Statistics, Function Graphing, and Data Visualization. Construction highlights the use of Slider Animation, Graphing, and Coordinate Geometry commands in GeoGebra. Suitable for high school students and teachers for probability statistics education and data analysis introduction.
AI Drawing Prompt Reference
Create a visual probability calculator showing probability distributions with slider animations, function graphs, and a coordinate system, suitable for high school students and teachers in probability statistics education and data analysis introduction.
The prompt above was compiled from the original drawing commands and is for reference only.