
Prism and Cosine Theorem 3D Visualization
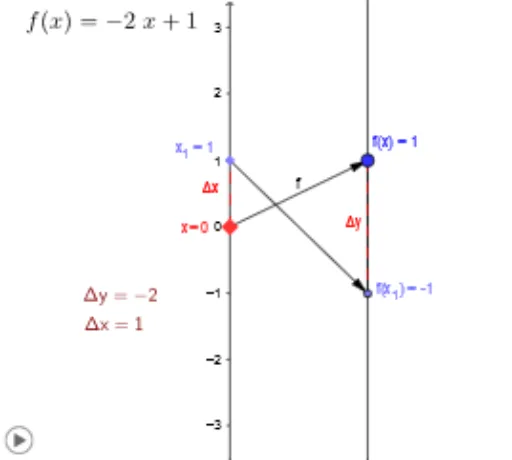
Loading the math board and drawing, please wait…
This example demonstrates the geometric construction of prisms and the application of the cosine theorem in 3D shapes. Key math concepts include prism volume calculation, cosine theorem, and coordinate geometry. It uses commands like Point, Vector, Textfield, Segment to create prism vertices, vectors, texts, and segments. Suitable for high school solid geometry and trigonometry teaching, helping visualize complex geometric relationships.
GeoGebra Commands & Parameters
Point(yAxis) → AVector(A, B) → uTextfield(f) → inputBox1Point(yAxis) → x_1Vector(x_1, y_1) → vSegment(f_x, F) → cSegment(E, F) → dSegment(A, x_1) → eSegment(B, y_1) → gSegment(B, y_1) → h
AI Drawing Prompt Reference
Visualize a 3D geometric prism and the application of the cosine theorem. Start by plotting a point on the y-axis and draw a vector from it to another point to form the base of the prism. Then, connect several points with line segments to create the sides and base of the prism. Include a text box for input parameters and use line segments to represent vectors, clearly demonstrating the volume calculation, cosine theorem, and coordinate geometry concepts for educational purposes.
The prompt above was compiled from the original drawing commands and is for reference only.