
Power of a Test
Loading the math board and drawing, please wait…
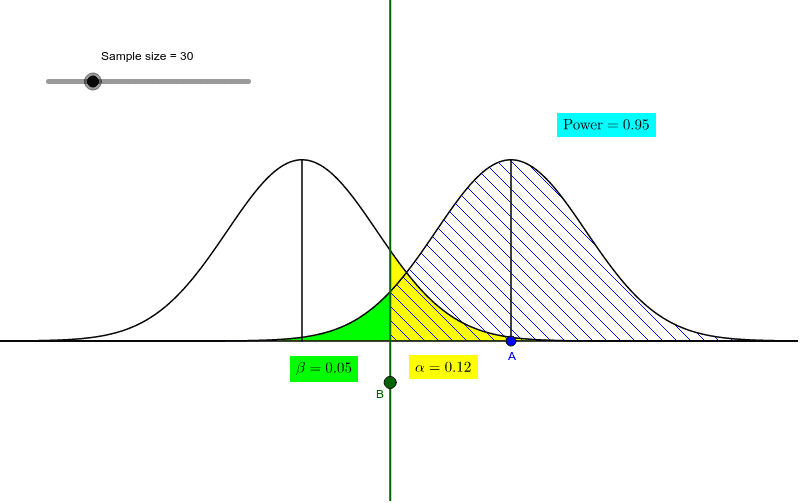
This example illustrates the concept of the power of a test, which is the probability of correctly rejecting a false null hypothesis. By adjusting parameters, you can observe how to increase the power of a test. The example uses commands such as Normal (normal distribution), Point (point), OrthogonalLine (perpendicular line), Integral (integral), and Segment (line segment). Suitable for high school math teachers and students studying hypothesis testing and statistics.
GeoGebra Commands & Parameters
Normal(0, 1 / sqrt(n), x) → fPoint(xAxis) → ANormal(x(A), 1 / sqrt(n), x) → gPoint(b) → BOrthogonalLine(B, b) → cIntegral(f, x(B), 10) → dIntegral(g, -10, x(B)) → eIntegral(g, x(B), 10) → hSegment((0, 0), (0, f(0))) → iSegment(A, (x(A), g(x(A)))) → j
AI Drawing Prompt Reference
Draw a graph illustrating the concept of the power of a test, featuring a normal distribution curve and two perpendicular lines. Start by plotting a normal distribution curve centered at the origin, then draw a vertical line intersecting the curve, and from the intersection point, draw another vertical line. Calculate and display the integral areas between the two vertical lines to show the probability of correctly rejecting a false null hypothesis. Finally, draw line segments from the origin to the curve and from the intersection point to the other curve to help understand the integral ranges.
The prompt above was compiled from the original drawing commands and is for reference only.