
Polynomial Curve Fit
Loading the math board and drawing, please wait…
In collections
Statistics Demonstrations
Statistics Demonstrations
Statistics Demonstrations
Statistics Demonstrations
Statistics Demonstrations
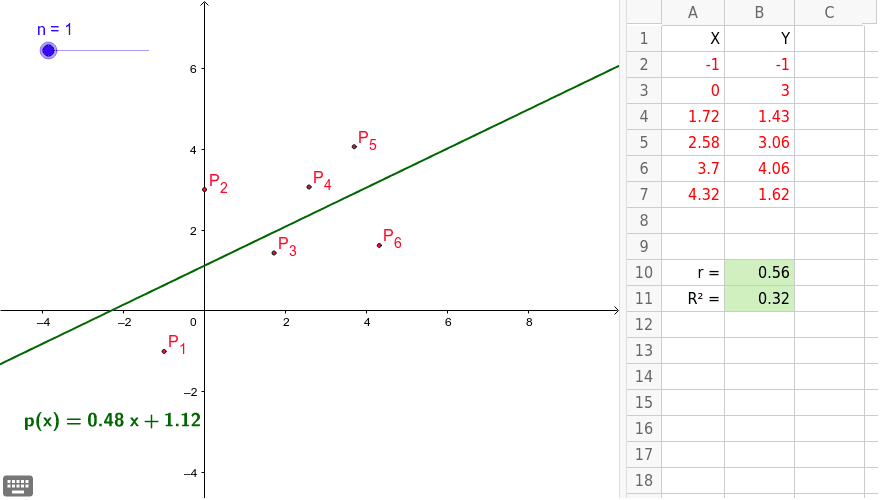
This example demonstrates how to adjust the polynomial curve to fit data points using a slider. The FitPoly command is used to generate polynomials of different orders. Key concepts include polynomial functions and curve fitting. Suitable for high school mathematics education, aiding students in understanding the principles of polynomial fitting.
GeoGebra Commands & Parameters
FitPoly(L_1, n) → fPMCC(L_1) → rRSquare(L_1, f) → r2
AI Drawing Prompt Reference
Draw a set of data points and adjust a polynomial curve to fit them using a slider. First, generate polynomials of different orders with the FitPoly command and observe the changes in the curve. Then calculate the Pearson's correlation coefficient PMCC and the coefficient of determination RSquare to assess the fitting quality.
The prompt above was compiled from the original drawing commands and is for reference only.