
Polar vs Regular Curves
Loading the math board and drawing, please wait…
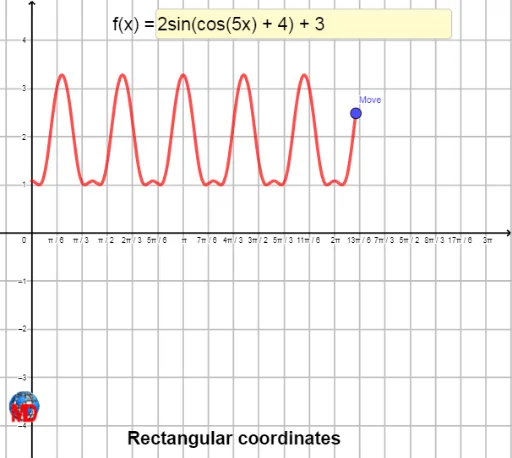
This example demonstrates the comparison and plotting of polar curves versus regular Cartesian curves. It involves core mathematical concepts such as polar and Cartesian coordinate systems, ellipses, trigonometric functions, linear functions, slope and normal, and normal distribution. The construction uses GeoGebra commands like Point, Textfield, CurveCartesian, and objects like f (function), A (point), InputBox1 (input box), a (parameter), E (ellipse), g (curve), texte1 (text), texte2 (text), image1 (image), and h. Suitable for high school and above students to understand function graphing and property analysis in different coordinate systems.
GeoGebra Commands & Parameters
Point(f) → ATextfield(f) → InputBox1CurveCartesian((f(x(A) - k) * sin(k)), (f(x(A) - k) * cos(k)), k, 0, x(A)) → aCurveCartesian((f(θ); θ), θ, 0, (2 * π)) → h