
Plotting Polar Functions
Loading the math board and drawing, please wait…
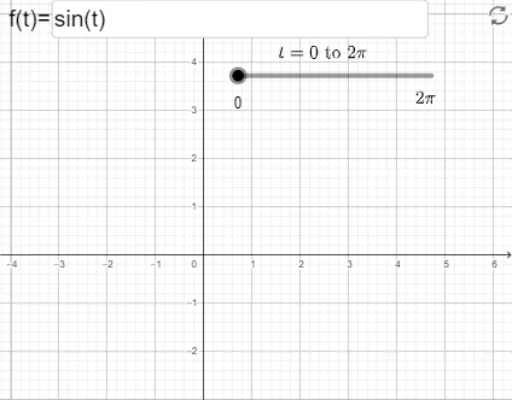
This example demonstrates how to plot functions in polar coordinates. It involves core math concepts like polar coordinates, trigonometric functions, and function graphing. Construction highlights include using CurveCartesian for Cartesian curve plotting, Textfield for text display, and parameters a, f, b, along with InputBox1, text1, text2, text3, text4 for input/output. Suitable for high school mathematics teaching and function graphing learning.
GeoGebra Commands & Parameters
CurveCartesian((cos(t) * f(t)), (sin(t) * f(t)), t, 0, a) → bTextfield(f) → InputBox1
AI Drawing Prompt Reference
Plot a polar function graph to demonstrate core math concepts like polar coordinates, trigonometric functions, and function graphing. Use a curve tool to draw the function controlled by parameters, and add text fields to display parameter values, suitable for high school math teaching and function graphing learning.
The prompt above was compiled from the original drawing commands and is for reference only.