
Investigation of sin(x)/x Limit
Loading the math board and drawing, please wait…
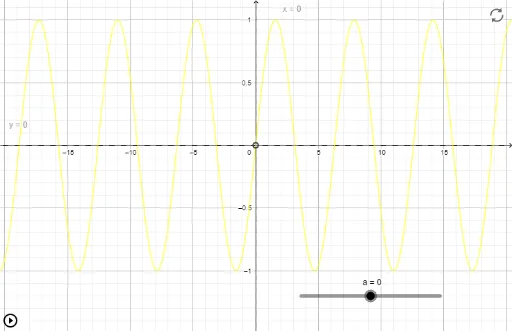
This example demonstrates the behavior of the ratio sin(x)/x as x approaches zero, focusing on the concept of limits in calculus. Key mathematical concepts include limits, properties of trigonometric functions, and the asymptotic behavior of function graphs. The construction uses GeoGebra commands like OrthogonalLine with objects such as functions f, g, points a, A, h, B, C, and auxiliary points i, j, along with slider animations to visualize the limit process. Suitable for high school and above students studying calculus and trigonometry to intuitively grasp the concept of limits.
GeoGebra Commands & Parameters
OrthogonalLine(A, xAxis) → iOrthogonalLine(A, yAxis) → j
AI Drawing Prompt Reference
Plot the graph of the function sin(x)/x and observe its behavior as x approaches 0. Use point A and the x-axis and y-axis to construct two perpendicular lines i and j, which will help understand the limit concept of the function as x gets close to 0.
The prompt above was compiled from the original drawing commands and is for reference only.