
Polar Graph Construction Example
Loading the math board and drawing, please wait…
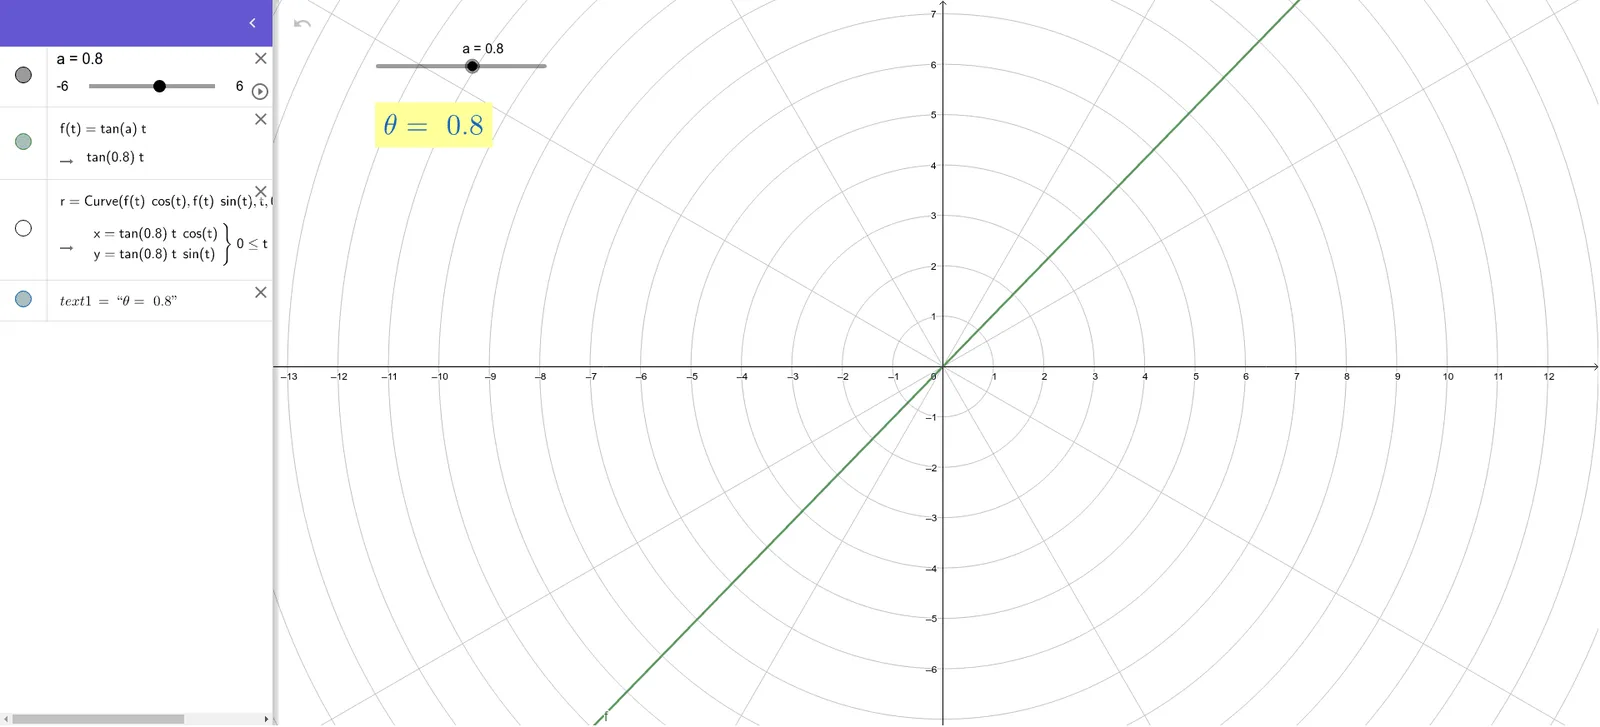
This example demonstrates how to plot polar graphs using GeoGebra, focusing on transformations and inequalities. Key math concepts include polar coordinates, function graphing, dilation, and line segment constructions. The construction uses the CurveCartesian command with parameters a, f, r, and text1 for annotations. Suitable for high school mathematics education to explore polar equations and their applications.
GeoGebra Commands & Parameters
CurveCartesian((f(t) * cos(t)), (f(t) * sin(t)), t, 0, (2 * π)) → r