
Polar Coordinates Grapher
Loading the math board and drawing, please wait…
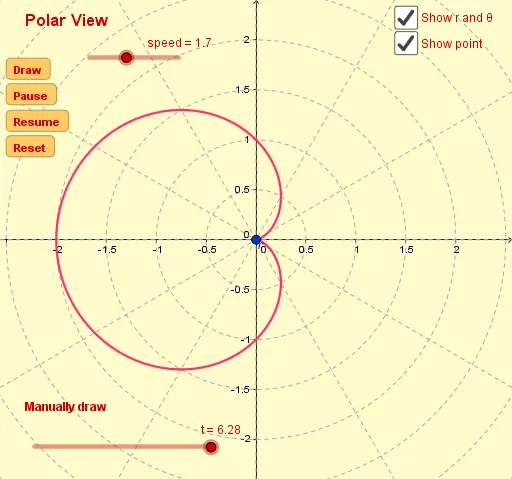
This example demonstrates how to plot graphs of polar coordinate equations. Key math concepts include polar coordinates, trigonometric functions, and function graphing. It utilizes GeoGebra commands and objects like Textfield, CurveCartesian, Segment, Intersect, CircleSector. Suitable for high school and above students to learn about polar coordinate systems and function graphs.
GeoGebra Commands & Parameters
Textfield(f) → InputBoxFunctionTextfield(θmin) → InputBoxθminTextfield(θmax) → InputBoxθmaxCurveCartesian((f(θ) * cos(θ)), (f(θ) * sin(θ)), θ, θmin, t) → CurveSegment((0, 0), P) → segmentIntersect(segment, xAxis) → CCircleSector(C, B, A) → sector