
Second Derivative Test: Visualizing Extrema of Functions
Loading the math board and drawing, please wait…
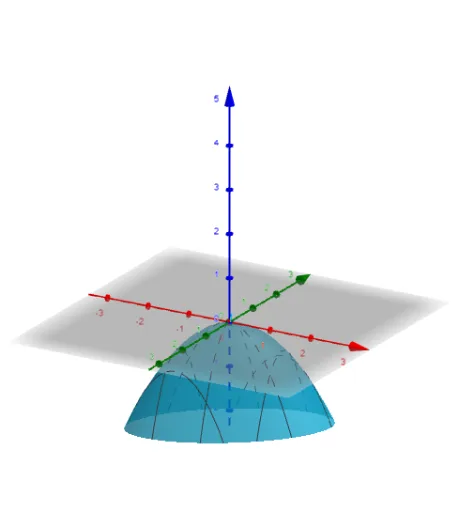
① This example provides an interactive visualization of the second derivative test, demonstrating how to determine whether a critical point of a function is a local maximum, local minimum, or inflection point. ② It covers core calculus concepts including derivatives, second derivatives, the test conditions (f''>0 for minimum, f''<0 for maximum, f''=0 for inconclusive), and integrates trigonometric functions and parametric curves for richer examples. ③ The construction uses GeoGebra's LaTeX command to render mathematical formulas, with adjustable parameters a, b, c that define the function f and its second derivative D. Text objects text1 through text4 dynamically display the computed values and the classification result, updating in real time as sliders change. ④ Suitable for advanced high school or introductory college calculus students, this resource is ideal for classroom demonstrations or self-paced exploration, helping learners grasp how derivatives reveal function shape and extremum behavior.
GeoGebra Commands & Parameters
LaTeX(f, true, true) → text2