
Polar Coordinates Example 1
Loading the math board and drawing, please wait…
In collections
Visualization of limits of functions of two variables
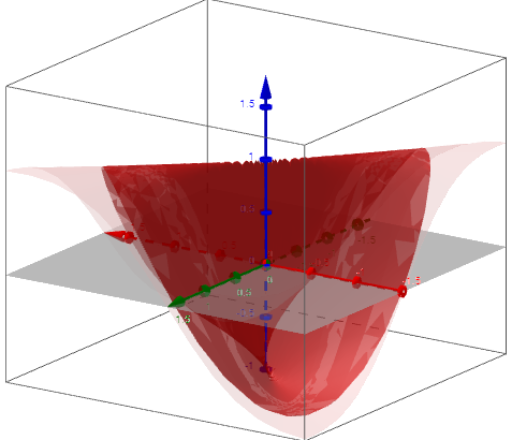
This example demonstrates how to plot graphs using polar coordinates, involving core math concepts like polar coordinates, trigonometry, and similarity. It constructs using GeoGebra objects f (function), r (radius), a (angle), and b (parameter), suitable for high school mathematics learning and exploration of polar coordinate applications.
GeoGebra Commands & Parameters
f(x, y) = ((2 * x) * y / (x^(2) + y^(2)))Numeric r(1.5)a(x, y) = x^(2) + y^(2) ≤ r^(2)b(x, y) = If[x^(2) + y^(2) ≤ r^(2), f(x, y)]