
Disc Method - Volume of Solid of Revolution
Loading the math board and drawing, please wait…
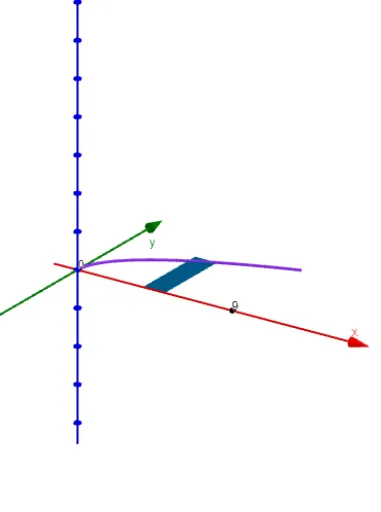
This example demonstrates the calculation of the volume of a solid of revolution using the disc method. It involves core calculus concepts like integration, function graphs, and volume calculation of solids. The construction utilizes GeoGebra commands such as Sequence, Intersect, Polygon, Circle, Cylinder, Dilate, Segment, Textfield, and Integral. It is suitable for high school and above students learning calculus volume methods or for educational demonstrations.
GeoGebra Commands & Parameters
Sequence(Polygon[(a + (i * deltax), 0), (a + ((i + 1) * deltax), 0), (a + ((i + 1) * deltax), f(a + ((i + 1) * deltax))), (a + (i * deltax), f(a + ((i + 1) * deltax)))], i, 0, n - 1, 1) → list1Intersect(i, l) → BIntersect(k, l) → CIntersect(j, k) → DPolygon(C, B, A, D) → poly1, c_2, b_1, a_1, dSequence((a + (i * deltax), 0), i, 0, n, 1) → list2Sequence((a + (i * deltax), f(a + (i * deltax))), i, 1, n, 1) → list3Sequence((a + (i * deltax), f(a + ((i + 1) * deltax))), i, 0, n - 1, 1) → list4Sequence(x = a + (i * deltax), i, 1, n, 1) → list6Sequence(Segment[Element[list3, i], Element[list4, i]], i, 0, n, 1) → list5Sequence(Cylinder[Element[list2, i], Element[list2, i + 1], f(Element[list2, i + 1])], i, 1, n, 1) → list8Sequence(Circle[Element[list2, i], f(Element[list2, i]), x = 0], i, 2, n + 1, 1) → list10Circle((a, 0), f(a + deltax), x = 0) → pCylinder((x(A), 0), (x(A) - deltax, 0), y(A)) → o, r, s, tDilate(E, If[0 < u ≤ 1, 1 - u, 0], D) → E'Dilate(F, If[0 < u ≤ 1, 1 - u, 0], A) → F'Segment(E, E') → f_1Segment(F, F') → g_1Dilate(D, If[1 < u ≤ 2, 2 - u, 0], A) → D'_1Segment(D, D'_1) → h_1Textfield(f) → InputBox1Textfield(a) → InputBox2Textfield(b) → InputBox3Integral(f, a, b) → m_1
AI Drawing Prompt Reference
Draw a function graph and its solid of revolution for volume calculation. First, plot the function curve, then use polygons and cylinders within the integral interval to represent the solid, and finally label the integral symbol for volume calculation. The construction sequence includes plotting the function, generating polygons and cylinders within the integral interval, showing the solid of revolution, and labeling the integral interval and volume formula.
The prompt above was compiled from the original drawing commands and is for reference only.