
Function Limit Non-Existence Study
Loading the math board and drawing, please wait…
In collections
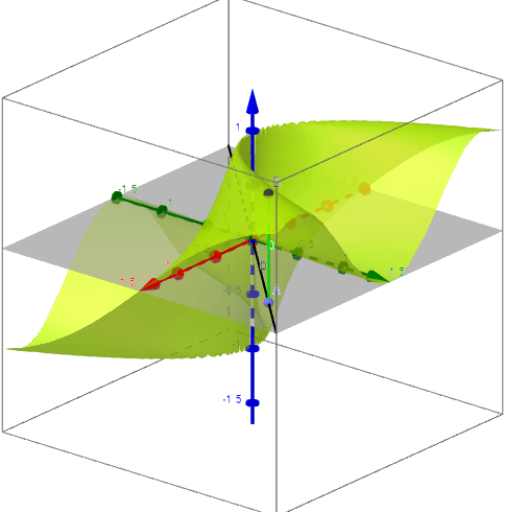
Visualization of limits of functions of two variables
This example demonstrates the graphical phenomenon of non-existence of a function's limit. Key math concepts include limits, straight-line paths, and function graph analysis. GeoGebra commands used are Point and Segment, with objects like g, m, b, texto1, A, B, a, c, d, e, texto2. Suitable for high school and above mathematics education, focusing on understanding limit dependence on paths.
GeoGebra Commands & Parameters
Point(b) → ASegment(A, B) → a
AI Drawing Prompt Reference
Draw a graph showing the non-existence of a function's limit. First, draw a straight line as a path, then take a point on the line as the input value for the function. Observe how the function values change as the path changes, demonstrating the non-existence of the limit.
The prompt above was compiled from the original drawing commands and is for reference only.