
Plotting Parametric Equations
Loading the math board and drawing, please wait…
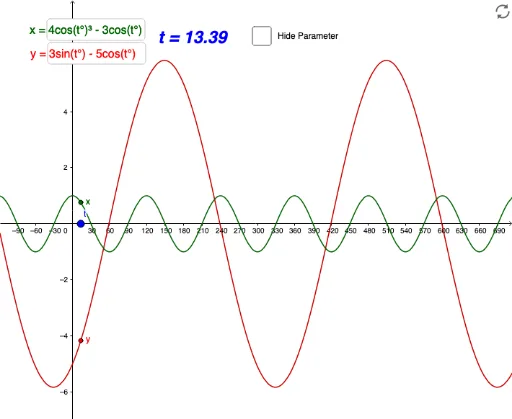
This example demonstrates how to plot parametric equations using GeoGebra, covering core concepts like parametric curves, coordinate geometry, and function graphing. Key GeoGebra commands and objects used include Point, Textfield, CurveCartesian, Tangent, and OrthogonalLine for constructing the graph. Suitable for high school and above students learning about parametric equations applications.
GeoGebra Commands & Parameters
Point(xAxis) → ATextfield(f) → InputBox1Textfield(g) → InputBox2CurveCartesian(f(t), g(t), t, 0, x(A)) → aTangent(D, a) → bOrthogonalLine(D, b) → c
AI Drawing Prompt Reference
Draw a parametric curve and mark its starting point, input two function expressions, use these expressions to plot the parametric curve, then draw a tangent line at an arbitrary point on the curve, and draw a perpendicular line through that point to show the relationship between the tangent and the curve.
The prompt above was compiled from the original drawing commands and is for reference only.